Kimberly-Clark Corporation (NYSE: KMB) manufactures and markets personal care and consumer tissue products worldwide. It operates three segments:
- Personal Care offers disposable diapers, training and youth pants, swimpants, baby wipes, feminine and incontinence care products, and other related products
- Consumer Tissue provides facial and bathroom tissues, paper towels, napkins, and related products
- K-C Professional offers wipers, tissues, towels, apparel, soaps, and sanitizers
| Segment | 2020 Revenue (USD billions) | Revenue % |
| Personal Care | 9.34 | 49% |
| Consumer Tissue | 6.72 | 35% |
| K-C Professional | 3.02 | 16% |
KMB’s revenues are geographically diversified with 47% of sales coming from outside the U.S.
KMB’s Dividend History and Payout Ratio
KMB has a track record of paying and increasing dividends for 49 consecutive years, one year away from obtaining the title of dividend king (a company that has a track record of increasing dividend payouts for more than 50 years), the most prestigious dividend growth category there is.
In 2020, the company paid out only 62% of its profits in the form of dividends. This low payout ratio enables the company to keep growing its dividend in the future, even if earnings are not growing or temporarily declining. In looking at the company’s payout ratio history over the past 30 years, we see a big spike in 1995.
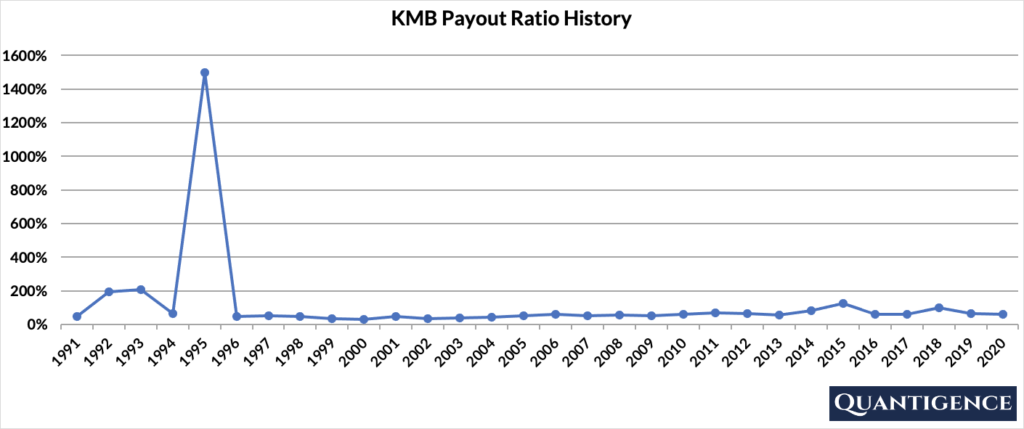
In 1995, restructuring and other unusual one-off charges affected the company’s bottom line. These included a non-operating charge for foreign currency losses resulting from the devaluation of the Mexican peso, the sale of 80% of Midwest Express Holdings, and asset disposals. These charges decreased KMB’s profits by 95.6% compared to the previous year.
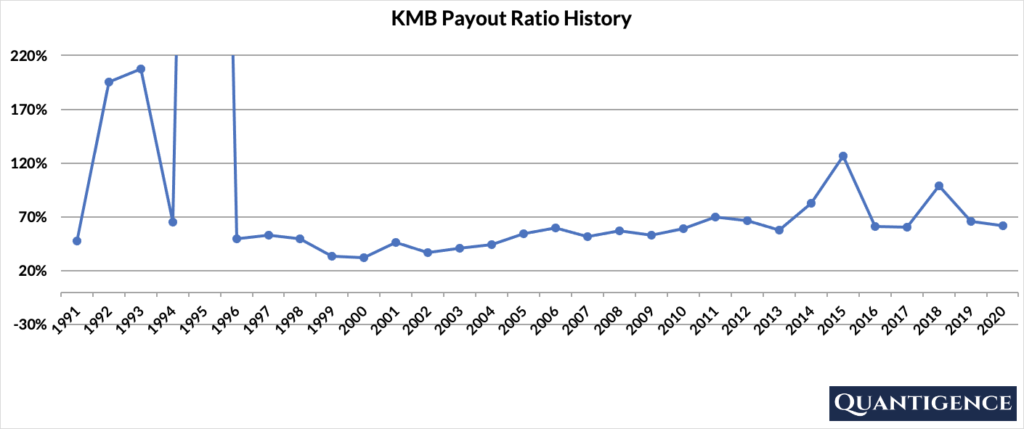
If we zoom in on the payout ratio chart leaving out the extreme value of 1995, we see a much smoother history that still passes the 100% boundary in a number of years, specifically in 1992, 1993, and 2015.
When Does KMB Pay Dividends?
KMB pays a quarterly dividend typically announced on various dates in January, May, August, and November. The ex-dates are in the first week of March, June, September, and December, and payments are made in the first week of the following months (April, July, October, and January).
What is KMB’s Dividend Yield?
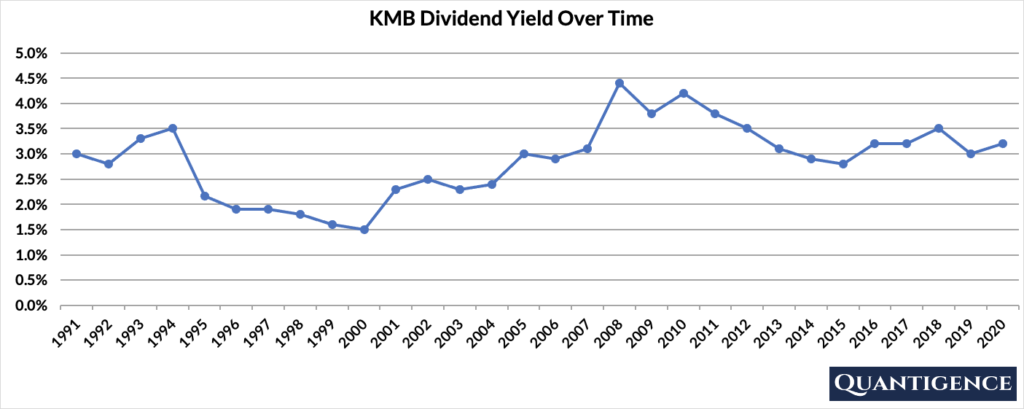
Dividend yield (the annual dividend paid divided by the share price) shows the 1-year income for a stock from dividends. In 2020, KMB had a dividend yield of 3.2%, significantly higher than our investment universe average of 1.8%. The stock’s historical yield has been moving between 1.5% and 4.4% with an average of 2.9%.
KMB’s Dividend Growth Rate
KMB has grown its dividend by an average of 5.0% every year for the past 10 years. That growth rate seems to be decreasing slightly with the annual average being 4.0% over the last five years. Below you can see the effect a 10-year growth rate of 5.0% has on KMB’s dividend assuming a starting yield of 3.2%.
| Years | Dividend Growth | Yield Calculation | Yield % |
| Year 0 | 0% | 3.20% | 3.2% |
| Year 1 | 5.00% | 3.2%*1.05 | 3.36% |
| Year 2 | 5.00% | 3.2%*(1.05)^2 | 3.53% |
| Year 3 | 5.00% | 3.2%*(1.05)^3 | 3.70% |
| Year 4 | 5.00% | 3.2%*(1.05)^4 | 3.89% |
| Year 5 | 5.00% | 3.2%*(1.05)^3 | 4.08% |
| Year 6 | 5.00% | 3.2%*(1.05)^6 | 4.29% |
| Year 7 | 5.00% | 3.2%*(1.05)^7 | 4.50% |
| Year 8 | 5.00% | 3.2%*(1.05)^8 | 4.73% |
| Year 9 | 5.00% | 3.2%*(1.05)^9 | 4.96% |
| Year 10 | 5.00% | 3.2%*(1.05)^10 | 5.21% |
If you bought KMB at a yield of 3.2%, an average 10-year dividend growth of 5.0% would mean your yield would be 5.21% 10 years from now. This is called “yield on cost,” and shows the yield you’re receiving on the original amount of money you invested.
How Strong is KMB’s Dividend?
When evaluating dividend stocks, we use our own methodology which is based on Q-scores which consist of seven factors:
- Years paying and increasing dividends
- Market cap
- International sales
- Yield
- Payout ratio
- Five-year dividend growth rate
- Ten-year dividend growth rate
We calculate each of these factors and summarize them in a final proprietary Q-score. To learn more about how we calculate Q-scores, check out our piece on “7 Factors Used to Select Dividend Growth Stocks.”
The Q-score for the Kimberly-Clark Corporation is presently the ninth Q-score by ranking in the consumer staples sector consisting of 14 dividend champions. We reward KMB for its dividend growth track record, yield, and international sales. We penalize it for its low five-year dividend growth rate. Its size, payout ratio, and 10-year dividend growth rate contribute smaller amounts to the company’s final Q-score.
With many better alternatives in the consumer staples sector, we do not include Kimberly-Clark in our final 30-stock dividend growth portfolio.
[optin-monster slug=”ziwrnabndtepsyq0fyai”]