Illinois Tool Works Inc. (NYSE: ITW) manufactures and sells industrial products and equipment worldwide. It operates seven segments:
- Automotive OEM offers plastic and metal components, fasteners, and assemblies for automobiles, light trucks, and other industrial uses
- Food Equipment provides warewashing, refrigeration, cooking, and food processing equipment and maintenance and repair services
- Test & Measurement and Electronics sells equipment, consumables, and related software for testing and measuring of materials and structures, as well as equipment and consumables used in the production of electronic subassemblies and microelectronics
- Welding produces arc welding equipment and related consumables and accessories
- Polymers & Fluids produces adhesives, sealants, lubrication and cutting fluids, and fluids and polymers for auto aftermarket maintenance and appearance
- Construction Products offers engineered fastening systems and solutions for the residential construction, renovation, and commercial construction markets
- Specialty Products offers beverage packaging equipment and consumables, product coding and marking equipment and consumables, and appliance components and fasteners
| Segment | 2020 Revenue (USD billions) | Revenue % |
| Automotive OEM | 2.57 | 20% |
| Test & Measurement and Electronics | 1.96 | 16% |
| Food Equipment | 1.74 | 14% |
| Specialty Products | 1.66 | 13% |
| Construction Products | 1.65 | 13% |
| Polymers & Fluids | 1.62 | 13% |
| Welding | 1.38 | 11% |
ITW’s revenues are geographically diversified with 56% of sales coming from outside the U.S.
ITW’s Dividend History and Payout Ratio
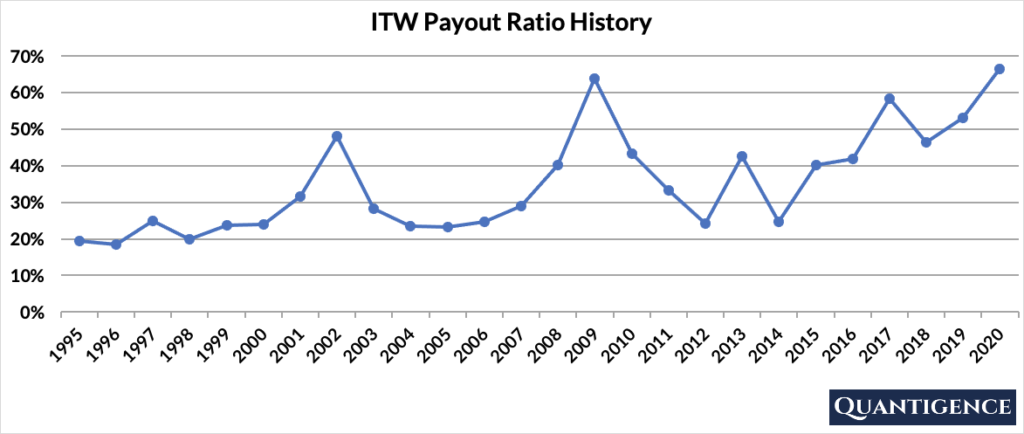
ITW has a track record of paying and increasing dividends for 46 consecutive years, a record that the company will feel highly obligated to maintain. In 2020, the company paid out only 66% of its profits in the form of dividends. This low payout ratio enables the company to keep growing its dividend in the future, even if earnings are not growing or temporarily declining. In looking at the company’s payout ratio history over the past 25 years, we see an upward trend but one that still has leeway to cover future dividend growth in the face of adversity.

When Does ITW Pay Dividends?
ITW pays a quarterly dividend typically announced on various dates in February, May, August, and October. The ex-dates are in the last days of March, June, September, and December, and payments are made in the second week of the following months (April, July, October, and January).
What is ITW’s Dividend Yield?
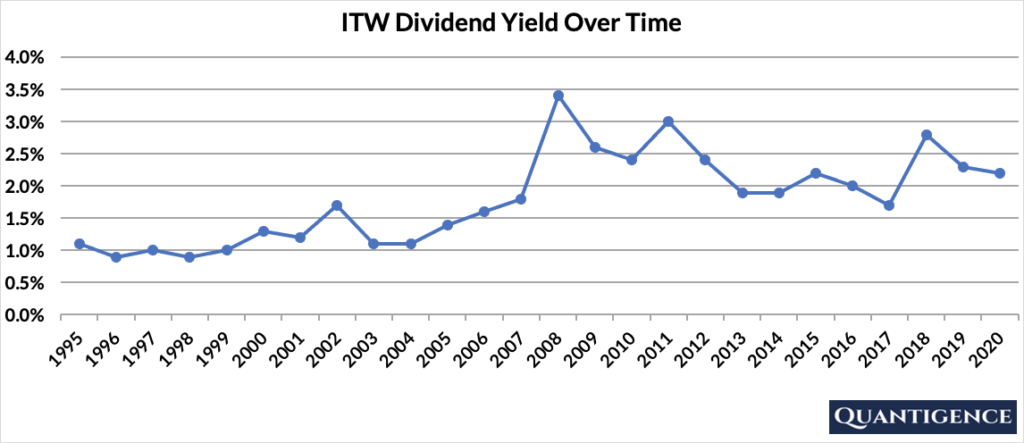
Dividend yield (the annual dividend paid divided by the share price) shows the 1-year income for a stock from dividends. In 2020, ITW had a dividend yield of 2.2%, higher than our investment universe average of 1.8%. The stock’s historical yield has been moving between 0.9% and 3.4% with an average of 1.8%.

ITW’s Dividend Growth Rate
ITW has grown its dividend by an average of 13.0% every year for the past 10 years. That growth rate seems to be increasing with the annual average being 16.4% over the last five years. Below you can see the effect a 10-year growth rate of 13.0% has on ITW’s dividend assuming a starting yield of 2.2%.
| Years | Dividend Growth | Yield Calculation | Yield % |
| Year 0 | 0% | 2.20% | 2.2% |
| Year 1 | 13.00% | 2.2%*1.13 | 2.49% |
| Year 2 | 13.00% | 2.2%*(1.13)^2 | 2.81% |
| Year 3 | 13.00% | 2.2%*(1.13)^3 | 3.17% |
| Year 4 | 13.00% | 2.2%*(1.13)^4 | 3.59% |
| Year 5 | 13.00% | 2.2%*(1.13)^3 | 4.05% |
| Year 6 | 13.00% | 2.2%*(1.13)^6 | 4.58% |
| Year 7 | 13.00% | 2.2%*(1.13)^7 | 5.18% |
| Year 8 | 13.00% | 2.2%*(1.13)^8 | 5.85% |
| Year 9 | 13.00% | 2.2%*(1.13)^9 | 6.61% |
| Year 10 | 13.00% | 2.2%*(1.13)^10 | 7.47% |
If you bought ITW at a yield of 2.2%, an average 10-year dividend growth of 13.0% would mean your yield would be 7.47% 10 years from now. This is called “yield on cost,” and shows the yield you’re receiving on the original amount of money you invested.
How Strong is ITW’s Dividend?
When evaluating dividend stocks, we use our own methodology which is based on Q-scores which consist of seven factors:
- Years paying and increasing dividends
- Market cap
- International sales
- Yield
- Payout ratio
- Five-year dividend growth rate
- Ten-year dividend growth rate
We calculate each of these factors and summarize them in a final proprietary Q-score. To learn more about how we calculate Q-scores, check out our piece on “7 Factors Used to Select Dividend Growth Stocks.”
The Q-score for Illinois Tool Works is presently the second Q-score by ranking in the industrials sector consisting of 16 dividend champions. We reward ITW for its dividend growth track record, international sales, and both five and 10-year dividend growth rates. Its size, yield, and payout ratio contribute smaller but still significant amounts to the company’s final Q-score. ITW doesn’t receive any penalties.
With the fourth-best Q-score in our entire investment universe of 72 stocks, Illinois Tool Works is a great addition to any dividend growth portfolio, including ours.
[optin-monster slug=”ziwrnabndtepsyq0fyai”]


Great content! Keep up the good work!