Church & Dwight Co. (NYSE: CHD) develops, manufactures, and markets household, personal care, and specialty products. It operates in three segments:
- Consumer Domestic markets baking soda-based products, as well as other products which use the same raw materials or technology, or which are sold in the same markets. The segment includes each of our 13 power brands divided into household and personal care product groups.
- Consumer International markets a variety of personal care, household and over-the-counter products in international subsidiary markets.
- Specialty Products Division focuses on sales to businesses and participates in three product areas: animal and food production, specialty chemicals, and specialty cleaners.
| Segment | 2020 Revenue (USD billions) | Revenue % |
| Consumer Domestic | 3.77 | 77% |
| Consumer International | 0.83 | 17% |
| Specialty Products Division | 0.30 | 6% |
As seen in the table above, CHD’s business focuses on the U.S. market and its revenues are only slightly diversified geographically.
CHD’s Dividend History and Payout Ratio
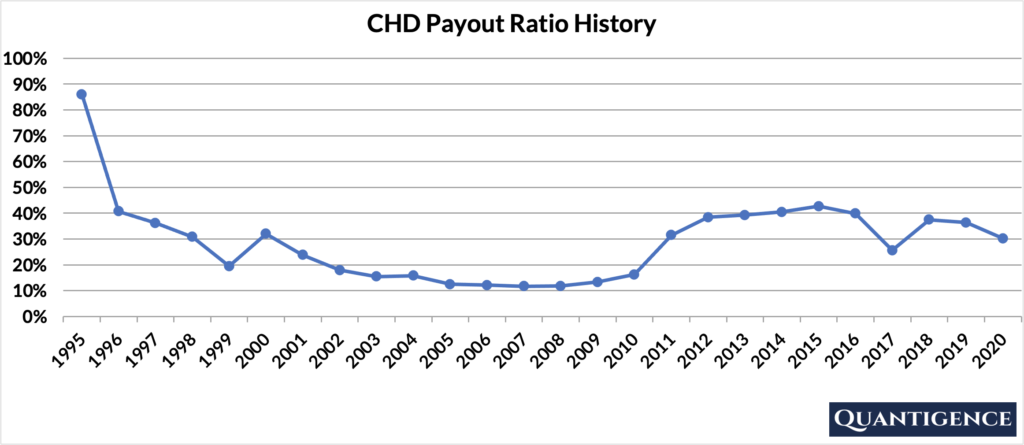
With 25 years of dividend growth track record, CHD is a newcomer to the prestigious club of dividend champions (companies that have a track record of increasing dividend payouts for more than 25 years). In 2020, the company paid out only 30% of its profits in the form of dividends. This low payout ratio enables the company to keep growing its dividend in the future, even if earnings are not growing or temporarily declining.
In looking at the company’s payout ratio history over the past 25 years, it’s been relatively stable with an average of 29%. CHD’s payout ratio spiked in 1995 because of one-off restructuring charges and has remained around or below 40% since then.
When Does CHD Pay Dividends?
CHD pays a quarterly dividend typically announced in late January/early February, late April/early May, late July/early August, and late October/early November. The ex-dates are usually around the middle of February, May, August, and November, and payments are made on the first day of the following months (March, July, September, and December).
What is CHD’s Dividend Yield?
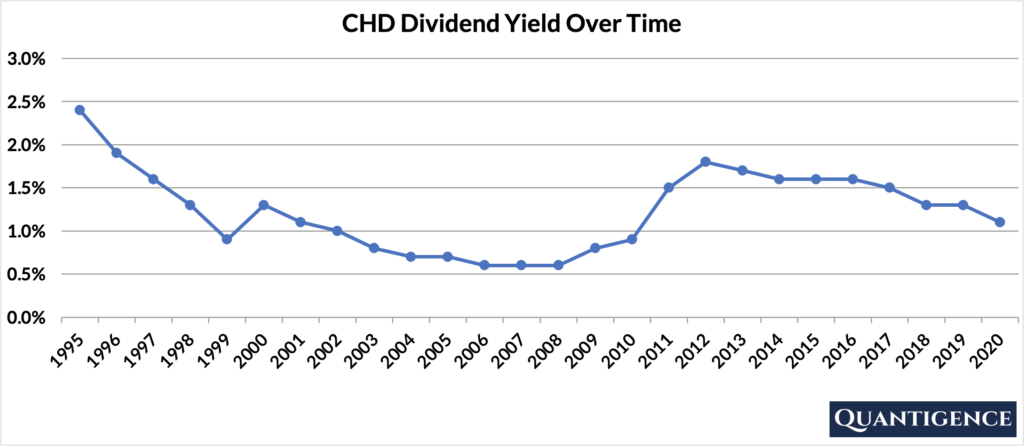
Dividend yield (the annual dividend paid divided by the share price) shows the 1-year income for a stock from dividends. In 2020, CHD had a dividend yield of 1.1%, lower than our investment universe average of 1.8%. The stock’s historical yield has been moving between 0.6% and 2.4% with an average of 1.2%.
CHD’s Dividend Growth Rate
CHD has grown its dividend by an average of 20.0% every year for the past 10 years. However, that growth seems to be slowing significantly with the annual dividend increase averaging 7.5% over the last five years, which is still a respectable growth rate that well outpaces inflation. Below you can see the effect a 10-year growth rate of 20.0% has on CHD’s dividend assuming a starting yield of 1.1%.
| Years | Dividend Growth | Yield Calculation | Yield % |
| Year 0 | 0% | 1.10% | 1.1% |
| Year 1 | 20.00% | 1.1%*1.200 | 1.32% |
| Year 2 | 20.00% | 1.1%*(1.200)^2 | 1.58% |
| Year 3 | 20.00% | 1.1%*(1.200)^3 | 1.90% |
| Year 4 | 20.00% | 1.1%*(1.200)^4 | 2.28% |
| Year 5 | 20.00% | 1.1%*(1.200)^3 | 2.74% |
| Year 6 | 20.00% | 1.1%*(1.200)^6 | 3.28% |
| Year 7 | 20.00% | 1.1%*(1.200)^7 | 3.94% |
| Year 8 | 20.00% | 1.1%*(1.200)^8 | 4.73% |
| Year 9 | 20.00% | 1.1%*(1.200)^9 | 5.68% |
| Year 10 | 20.00% | 1.1%*(1.200)^10 | 6.81% |
If you bought CHD at a yield of 1.1%, an average 10-year dividend growth of 20.0% would mean your yield would be 6.81% 10 years from now. This is called “yield on cost,” and shows the yield you’re receiving on the original amount of money you invested.
How Strong is CHD’s Dividend?
When evaluating dividend stocks, we use our own methodology which is based on Q-scores which consist of seven factors:
- Years paying and increasing dividends
- Market cap
- International sales
- Yield
- Payout ratio
- Five-year dividend growth rate
- Ten-year dividend growth rate
We calculate each of these factors and summarize them in a final proprietary Q-score. To learn more about how we calculate Q-scores, check out our piece on “7 Factors Used to Select Dividend Growth Stocks.”
The Q-score for Church & Dwight Co. is presently 10.1, which places the company in the 13th position out of 14 dividend champions in the consumer staples sector. We reward CHD for its low payout ratio and its excellent 10-year dividend growth rate. The company’s dividend growth track record, size, and five-year dividend growth rate contribute less to the final Q-score. We penalize CHD for its low yield and international sales. There are many better dividend champions to choose from in the consumer staples sector so we don’t include CHD in our final 30-stock dividend growth portfolio.
[optin-monster slug=”ziwrnabndtepsyq0fyai”]