Hormel Foods Corporation (NYSE: HRL) produces and markets various meat and food products to retail, food service, deli, and commercial customers. The company operates through four segments:
- Grocery Products sells shelf-stable food products mainly to the retail market
- Refrigerated Foods sells branded and unbranded pork, beef, chicken and turkey products to retail, food service, deli, and commercial customers
- Jennie-O Turkey Store sells branded and unbranded turkey products to retail, food service, and commercial customers
- International & Other covers the company’s international product sales and also includes results from international joint ventures and royalty arrangements
| Segment | 2020 Revenue (USD billions) | Revenue % |
| Refrigerated Foods | 5.27 | 55% |
| Grocery Products | 2.39 | 25% |
| Jenny-O Turkey Store | 1.33 | 14% |
| International & Other | 0.62 | 6% |
As seen in the table above, HRL’s revenues are somewhat diversified between its segments with a geographic focus on the U.S.
HRL’s Dividend History and Payout Ratio
HRL has a track record of paying and increasing dividends for 54 consecutive years, a record that the company will feel highly obligated to maintain. This dividend growth track record makes HRL a dividend king (a company that has a track record of increasing dividend payouts for more than 50 years), the most prestigious dividend growth category there is.
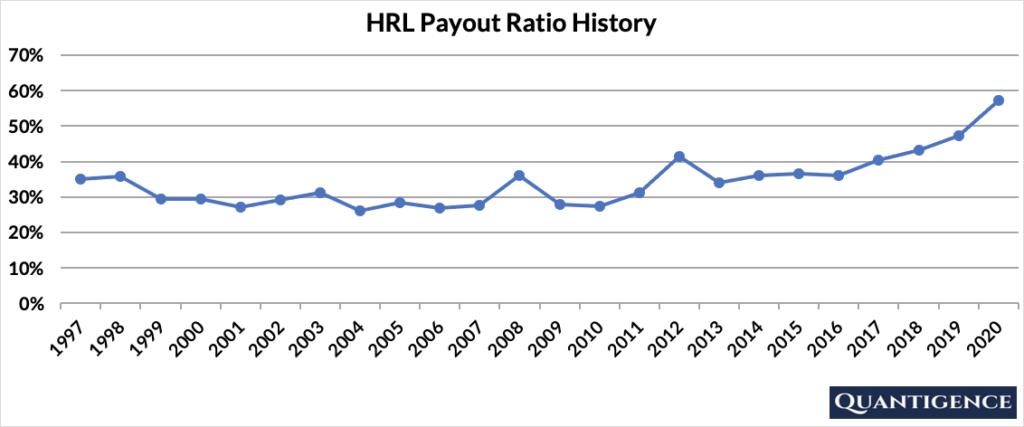
In 2020, the company paid out only 57% of its profits in the form of dividends. This low payout ratio enables the company to keep growing its dividend in the future, even if earnings are not growing or temporarily declining. In looking at the company’s payout ratio history over the past 24 years, it’s been relatively stable with an average of 34%.

HRL posted record sales of $9.6 billion in 2020 but earnings declined slightly thanks to $80 million of extra operational costs incurred because of the COVID-19 pandemic. Hence, HRL’s payout ratio increased.
When Does HRL Pay Dividends?
HRL pays a quarterly dividend typically announced in the second half of March, May, September, and November. The ex-dates are usually in the first half of April, July, October, and January, and payments are made in the middle of the following months (May, August, November, and February).
What is HRL’s Dividend Yield?
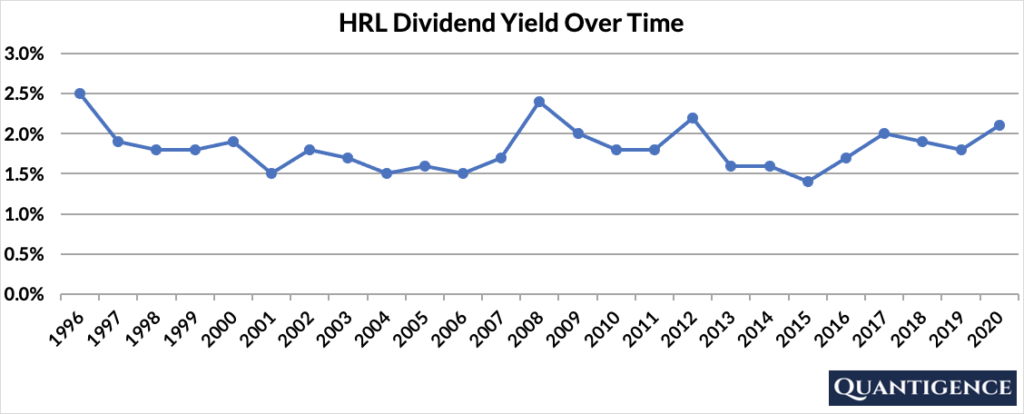
Dividend yield (the annual dividend paid divided by the share price) shows the 1-year income for a stock from dividends. In 2020, HRL had a dividend yield of 2.1%, higher than our investment universe average of 1.8%. The stock’s historical yield has been moving between 1.4% and 2.5% with an average of 1.8%.

HRL’s Dividend Growth Rate
HRL has grown its dividend payout by an average of 15.6% every year for the past 10 years, and 12.6% over the last five years, demonstrating stable high growth that well outpaces inflation. Below you can see the effect a 10-year growth rate of 15.6% has on HRL’s dividend assuming a starting yield of 2.1%.
| Years | Dividend Growth | Yield Calculation | Yield % |
| Year 0 | 0% | 2.10% | 2.1% |
| Year 1 | 15.60% | 2.1%*1.156 | 2.43% |
| Year 2 | 15.60% | 2.1%*(1.156)^2 | 2.81% |
| Year 3 | 15.60% | 2.1%*(1.156)^3 | 3.24% |
| Year 4 | 15.60% | 2.1%*(1.156)^4 | 3.75% |
| Year 5 | 15.60% | 2.1%*(1.156)^3 | 4.34% |
| Year 6 | 15.60% | 2.1%*(1.156)^6 | 5.01% |
| Year 7 | 15.60% | 2.1%*(1.156)^7 | 5.79% |
| Year 8 | 15.60% | 2.1%*(1.156)^8 | 6.70% |
| Year 9 | 15.60% | 2.1%*(1.156)^9 | 7.74% |
| Year 10 | 15.60% | 2.1%*(1.156)^10 | 8.95% |
If you bought HRL at a yield of 2.1%, an average 10-year dividend growth of 15.6% would mean your yield would be 8.95% 10 years from now, an excellent yield by all accounts. This is called “yield on cost,” and shows the yield you’re receiving on the original amount of money you invested.
How Strong is HRL’s Dividend?
When evaluating dividend stocks, we use our own methodology which is based on Q-scores which consist of seven factors:
- Years paying and increasing dividends
- Market cap
- International sales
- Yield
- Payout ratio
- Five-year dividend growth rate
- Ten-year dividend growth rate
We calculate each of these factors and summarize them in a final proprietary Q-score. To learn more about how we calculate Q-scores, check out our piece on “7 Factors Used to Select Dividend Growth Stocks.”
The Q-score for Hormel Foods Corporation is presently 13.1, which places the company in the 10th position out of 14 dividend champions in the consumer staples sector. We reward HRL for its dividend growth track record, low payout ratio, and its excellent five and 10-year dividend growth rates. We penalize the company for its lack of international sales. HRL’s size and yield are mediocre so they contribute little to its final Q-score. We have better alternatives in consumer staples so we do not include Hormel Foods in our final 30-stock dividend growth portfolio.
[optin-monster slug=”ziwrnabndtepsyq0fyai”]


