Automatic Data Processing, Inc. (NASDAQ: ADP) provides cloud-based human capital management solutions worldwide. It operates in two segments, Employer Services and Professional Employer Organization (PEO). The Employer Services segment offers strategic, cloud-based platforms, and HR outsourcing solutions. It covers payroll, benefits administration, talent management, HR management, workforce management, insurance, retirement, and compliance services. The PEO Services segment provides HR outsourcing solutions to small and mid-sized businesses through a co-employment model. This segment offers benefits package, protection and compliance, talent engagement, comprehensive outsourcing, and recruitment process outsourcing services.
| Segment | 2020 Revenue (in billion USD) | Revenue % |
| Employer Services | 10.09 | 69% |
| Professional Employer Organization (PEO) | 4.51 | 31% |
ADP’s revenues are concentrated in the U.S. with only 13% of sales generated outside its home country.
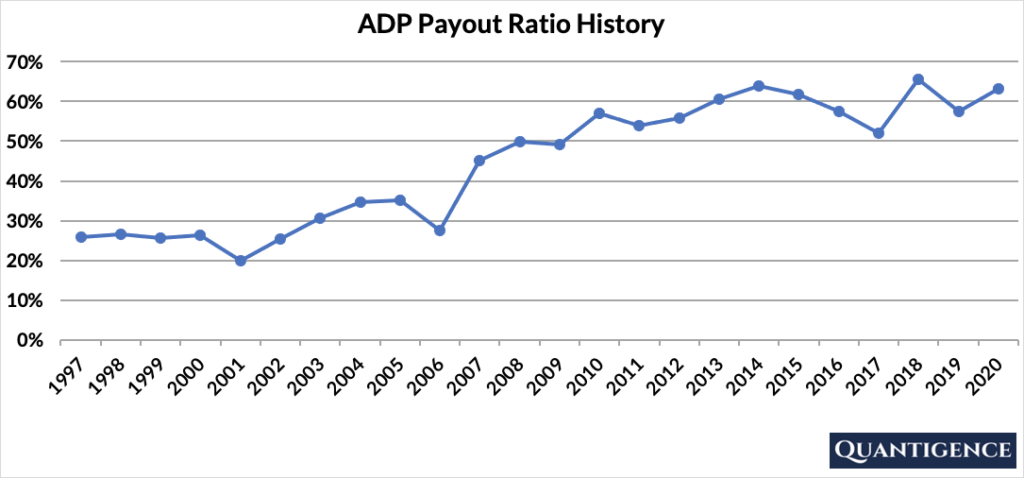
ADP’s Dividend History and Payout Ratio
ADP has an excellent track record of paying and increasing dividends for 45 consecutive years, a record that the company will feel highly obligated to maintain. In 2020, ADP paid out only 63% of its profits in the form of dividends. This relatively low payout ratio enables the company to keep growing its dividend in the future, even if earnings are not growing or temporarily declining. In looking at the company’s payout ratio history over the past 24 years, we see a slow but steady increase from 26% to more than 60%.
When Does ADP Pay Dividends?
ADP pays a quarterly dividend typically announced on various dates in January, April, August, and November. The ex-dates are usually in the second week of March, June, September, and December, and payments are made on the first day of the following months (April, July, October, and January).
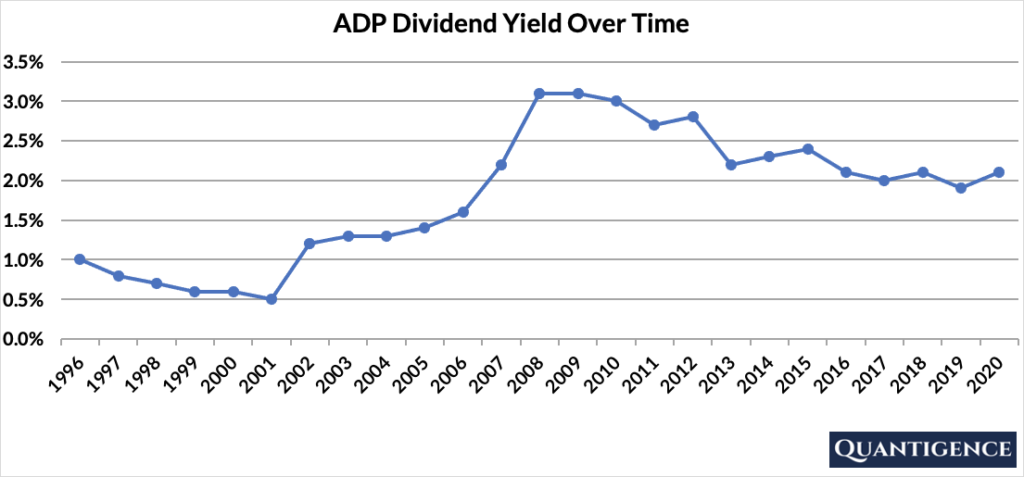
What is ADP’s Dividend Yield?
Dividend yield (the annual dividend paid divided by the share price) shows the 1-year return on a stock purchase in the form of dividends. In 2020, ADP had a dividend yield of 2.1%, higher than our investment universe average of 1.8%. The stock’s historical yield has been moving between 0.5% and 3.1% with an average of 1.8%.
ADP’s Dividend Growth Rate
ADP has grown its dividend payout by an average of 10.2% every year for the past 10 years. That growth seems to be accelerating lately with the annual dividend increase averaging 12.8% over the last five years, an excellent growth rate which well outpaces inflation. Below you can see the effect a 10-year growth rate of 10.2% has on ADP’s dividend assuming a starting yield of 2.1%.
| Years | Dividend Growth | Yield Calculation | Yield % |
| Year 0 | 0% | 2.10% | 2.1% |
| Year 1 | 10.20% | 2.1%*1.102 | 2.31% |
| Year 2 | 10.20% | 2.1%*(1.102)^2 | 2.55% |
| Year 3 | 10.20% | 2.1%*(1.102)^3 | 2.81% |
| Year 4 | 10.20% | 2.1%*(1.102)^4 | 3.10% |
| Year 5 | 10.20% | 2.1%*(1.102)^3 | 3.41% |
| Year 6 | 10.20% | 2.1%*(1.102)^6 | 3.76% |
| Year 7 | 10.20% | 2.1%*(1.102)^7 | 4.14% |
| Year 8 | 10.20% | 2.1%*(1.102)^8 | 4.57% |
| Year 9 | 10.20% | 2.1%*(1.102)^9 | 5.03% |
| Year 10 | 10.20% | 2.1%*(1.102)^10 | 5.55% |
If you bought ADP at a yield of 2.1%, an average 10-year dividend growth of 10.2% would mean your yield would be 5.55% 10 years from now. This is called “yield on cost,” and shows the yield we’re receiving on the original amount of money we invested.
How Strong is ADP’s Dividend?
When evaluating dividend stocks, we use our own methodology which is based on Q-scores which consist of seven factors:
- Years paying and increasing dividends
- Market cap
- International sales
- Yield
- Payout ratio
- Five-year dividend growth rate
- Ten-year dividend growth rate
We calculate each of these factors and summarize them in a final proprietary Q-score. To learn more about how we calculate Q-scores, check out our piece on “7 Factors Used to Select Dividend Growth Stocks.”
The Q-score for Automatic Data Processing is presently 11.9, the second-highest Q-score in our IT sector of three options. We reward ADP for its dividend growth track record, and its five and 10-year dividend growth rates. We penalize the stock for its lack of international sales. The rest of the factors are acceptable but not outstanding, so they contribute less to ADP’s overall Q-score. As we don’t have too much choice in the IT sector, the decision to include ADP in our final 30-stock dividend growth portfolio was pretty straightforward.