Brown & Brown, Inc. (NYSE: BRO) markets and sells insurance products and services in the United States, Bermuda, Canada, Cayman Islands, Ireland, and the United Kingdom. It operates through four segments:
- Retail provides a broad range of insurance products and services to commercial, public and quasipublic entities
- National Programs acts as a managing general agent, provides professional liability and related package products, a range of insurance products for individuals, flood coverage, and targeted products designated for specific industries, trade groups, governmental entities and market niches
- Wholesale Brokerage markets and sells excess and surplus commercial and personal lines insurance, primarily through independent agents and brokers
- Services provides insurance-related services, including third-party claims administration and adjusting services, comprehensive medical utilization management services in both the workers’ compensation and all-lines liability arenas, as well as Medicare Set-aside services and Social Security disability benefits advocacy services
| Segment | 2020 Revenue (in billion USD) | Revenue % |
| Retail | 1.471 | 56% |
| National Programs | 0.610 | 23% |
| Wholesale Brokerage | 0.352 | 14% |
| Services | 0.174 | 7% |
BRO has 332 domestic locations in 43 states and only nine international locations accounting for 0.8% of sales, so we can safely classify the company as a U.S. domestic business.
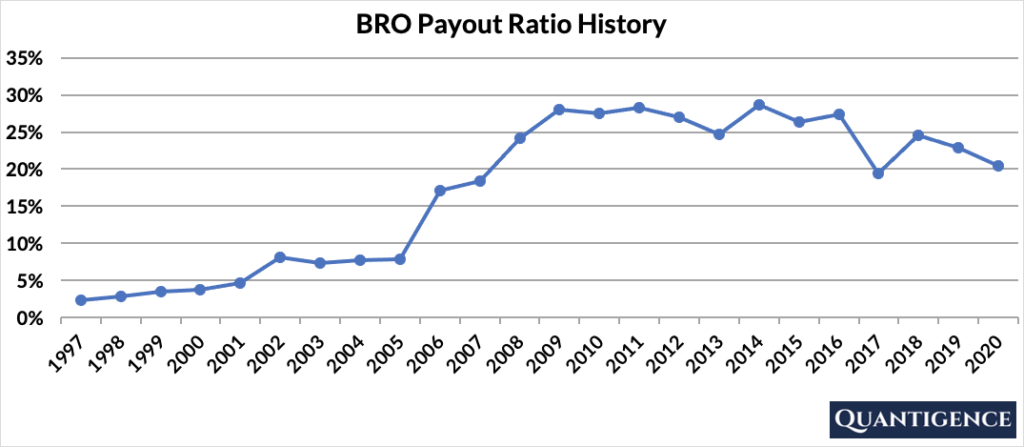
BRO’s Dividend History and Payout Ratio
BRO has a track record of paying and increasing dividends for 27 consecutive years, which makes the stock a relative newcomer to the exclusive club of dividend champions (companies that have a track record of increasing dividend payouts for more than 25 years).
In 2020, BRO paid out only 21% of its profits in the form of dividends. This low payout ratio enables the company to keep growing its dividend in the future, even if earnings are not growing or temporarily declining. In looking at the company’s payout ratio history over the past 20 years, it’s been remarkably low and stable.
When Does BRO Pay Dividends?
BRO pays a quarterly dividend typically announced in the second half of January, April, July, and October. The ex-dates are around the first week of the following months, and payments are made at the end of those months (February, May, August, and November).
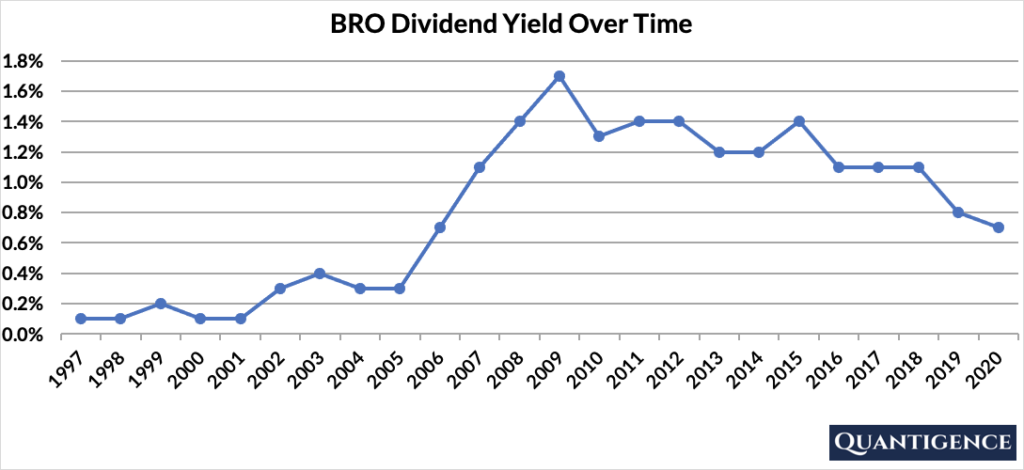
What is BRO’s Dividend Yield?
Dividend yield (the annual dividend paid divided by the share price) shows the 1-year return on a stock purchase in the form of dividends. In 2020, BRO had a dividend yield of 0.7%, less than half of our investment universe average of 1.8%. The stock’s historical yield has been moving between 0.1% and 1.7% with an average of 0.8%.
BRO’s Dividend Growth Rate
BRO has grown its dividend payout by an average of 8.3% every year for the past 10 years. That growth seems to be accelerating lately with the annual dividend increase averaging 9.0% over the last five years, a high growth number by all accounts. Below you can see the effect a 10-year growth rate of 8.3% has on BRO’s dividend assuming a starting yield of 0.7%.
| Years | Dividend Growth | Yield Calculation | Yield % |
| Year 0 | 0% | 0.70% | 0.7% |
| Year 1 | 8.30% | 0.7%*1.083 | 0.76% |
| Year 2 | 8.30% | 0.7%*(1.083)^2 | 0.82% |
| Year 3 | 8.30% | 0.7%*(1.083)^3 | 0.89% |
| Year 4 | 8.30% | 0.7%*(1.083)^4 | 0.96% |
| Year 5 | 8.30% | 0.7%*(1.083)^3 | 1.04% |
| Year 6 | 8.30% | 0.7%*(1.083)^6 | 1.13% |
| Year 7 | 8.30% | 0.7%*(1.083)^7 | 1.22% |
| Year 8 | 8.30% | 0.7%*(1.083)^8 | 1.32% |
| Year 9 | 8.30% | 0.7%*(1.083)^9 | 1.43% |
| Year 10 | 8.30% | 0.7%*(1.083)^10 | 1.55% |
If you bought BRO at a yield of 0.7%, an average 10-year dividend growth of 8.3% would mean your yield would be 1.55% 10 years from now. This is called “yield on cost,” and shows the yield you’re receiving on the original amount of money we invested.
How Strong is BRO’s Dividend?
When evaluating dividend stocks, we use our own methodology which is based on Q-scores which consist of seven factors:
- Years paying and increasing dividends
- Market cap
- International sales
- Yield
- Payout ratio
- Five-year dividend growth rate
- Ten-year dividend growth rate
We calculate each of these factors and summarize them in a final proprietary Q-score. To learn more about how we calculate Q-scores, check out our piece on “7 Factors Used to Select Dividend Growth Stocks.”
The Q-score for Brown & Brown is presently 7.7, the third-worst Q-score in our financials sector of nine available dividend champions. We reward BRO for its low payout ratio and its five and 10-year dividend growth rates. We penalize it for its low yield and international sales. The company’s size and dividend growth track record contributes a smaller amount to the overall Q-score. With many better options to choose from, we do not include BRO in our final 30-stock dividend growth portfolio.
[optin-monster slug=”ziwrnabndtepsyq0fyai”]