Raytheon Technologies Corporation (NYSE: RTX) is an aerospace and defense company that provides systems and services for commercial, military, and government customers worldwide. RTX operates through four segments:
- Collins Aerospace Systems offers aerospace and defense products, and aftermarket services for aviation, defense, and commercial space operations
- Pratt & Whitney supplies aircraft engines for commercial, military, business jet, and general aviation customers, and sells commercial auxiliary power units
- Raytheon Intelligence & Space develops integrated sensor and communication systems for missions, training, and cyber and software solutions to intelligence, defense, federal, and commercial customers
- Raytheon Missiles & Defense develops integrated air and missile defense systems, defensive and combat solutions, radars, command, control, communications, and intelligence solutions, and naval and undersea sensor solutions for the U.S. and foreign government customers
| Segment | 2020 Revenue (in billion USD) | Revenue % |
| Collins Aerospace Systems | 19.288 | 33% |
| Pratt & Whitney | 16.799 | 29% |
| Raytheon Intelligence & Space | 10.841 | 19% |
| Raytheon Missiles & Defense | 11.66 | 20% |
RTX’s revenues are well diversified geographically with 39% of sales coming from outside the U.S.
RTX’s Dividend History and Payout Ratio
RTX has a track record of paying and increasing dividends for 27 consecutive years, which makes it a relative newcomer to the prestigious club of dividend champions (companies that have a track record of increasing dividend payouts for more than 25 years).
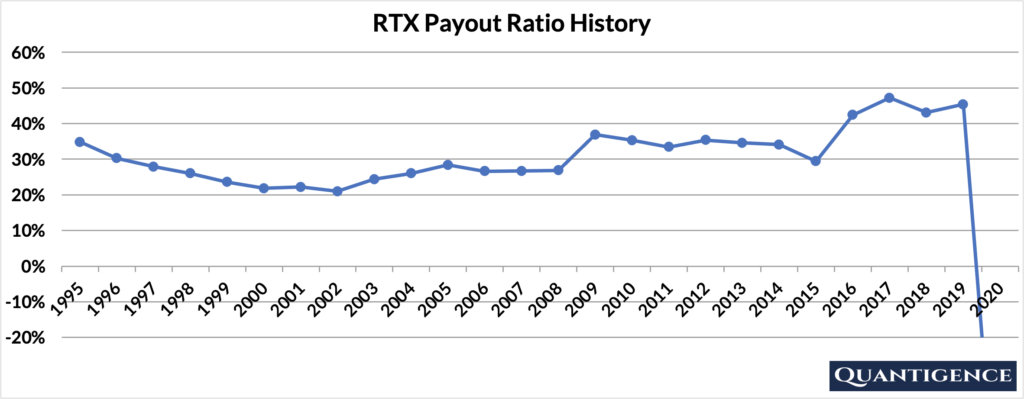
In 2020, RTX reported a losing quarter, and their payout ratio dropped into negative territory. Raytheon’s management attributes these losses to COVID-19’s impact on the Collins Aerospace and Pratt & Whitney businesses as well as restructuring charges of $777 million primarily related to personnel reductions at these two businesses to preserve capital.
The silver lining is that the company’s payout ratio history over the past 25 years has been remarkably stable, staying below 50% and enabling the company to keep growing its dividend even in the face of a losing quarter. As restrictions ease up, RTX should be in a good position to continue its dividend growth trajectory.

When Does RTX Pay Dividends?
RTX pays a quarterly dividend typically announced on various dates in February, April, June, and October. The ex-dates are around the middle of February, May, August, and November, and payments are made around the middle of the following months (March, June, September, and December).
What is RTX’s Dividend Yield?
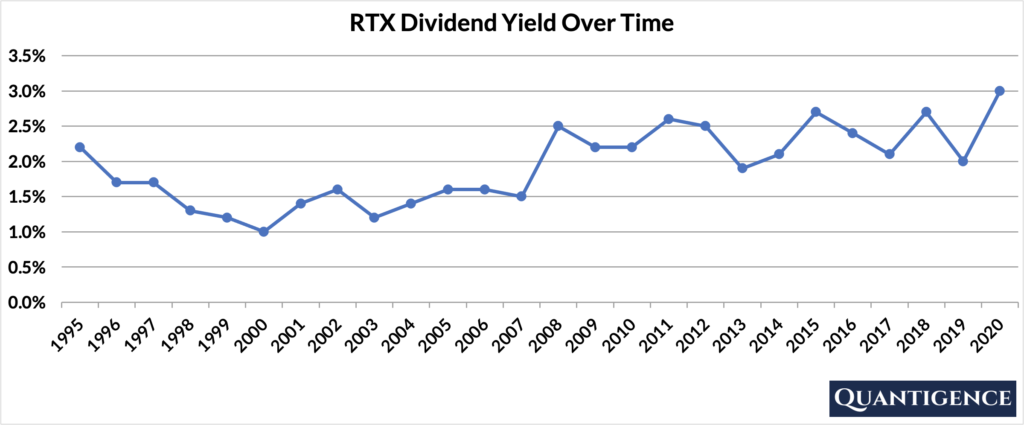
Dividend yield (the annual dividend paid divided by the share price) shows the 1-year return on a stock purchase in the form of dividends. In 2020, RTX had a dividend yield of 3.0%, close to double the value of our investment universe average of 1.8%, and the highest yield the company has offered in the past 25 years. The stock’s historical yield has been moving between 1.0% and 3.0% with an average of 1.9%.

RTX’s Dividend Growth Rate
RTX has grown its dividend payout by an average of 9.1% every year for the past 10 years. That growth seems to be accelerating lately with the annual dividend increase averaging 9.7% over the last five years, an excellent growth rate. Below you can see the effect a 10-year growth rate of 9.1% has on RTX’s dividend assuming a starting yield of 3.0%.
| Years | Dividend Growth | Yield Calculation | Yield % |
| Year 0 | 0% | 3.00% | 3.0% |
| Year 1 | 9.10% | 3.0%*1.108 | 3.27% |
| Year 2 | 9.10% | 3.0%*(1.108)^2 | 3.57% |
| Year 3 | 9.10% | 3.0%*(1.108)^3 | 3.90% |
| Year 4 | 9.10% | 3.0%*(1.108)^4 | 4.25% |
| Year 5 | 9.10% | 3.0%*(1.108)^3 | 4.64% |
| Year 6 | 9.10% | 3.0%*(1.108)^6 | 5.06% |
| Year 7 | 9.10% | 3.0%*(1.108)^7 | 5.52% |
| Year 8 | 9.10% | 3.0%*(1.108)^8 | 6.02% |
| Year 9 | 9.10% | 3.0%*(1.108)^9 | 6.57% |
| Year 10 | 9.10% | 3.0%*(1.108)^10 | 7.17% |
If you bought RTX at a yield of 3.0%, an average 10-year dividend growth of 9.1% would mean your yield would be an impressive 7.17% 10 years from now. This is called “yield on cost,” and shows the yield you’re receiving on the original amount of money you invested.
How Strong is RTX’s Dividend?
When evaluating dividend stocks, we use our own methodology which is based on Q-scores which consist of seven factors:
- Years paying and increasing dividends
- Market cap
- International sales
- Yield
- Payout ratio
- Five-year dividend growth rate
- Ten-year dividend growth rate
We calculate each of these factors and summarize them in a final proprietary Q-score. To learn more about how we calculate Q-scores, check out our piece on “7 Factors Used to Select Dividend Growth Stocks.”
The Q-score for Raytheon Technologies Corporation is presently 12.9, the fourth-worst value in the “Industrials” sector comprising 16 dividend growth stocks. Besides the payout ratio which we penalize, all other factors contribute a decent amount to RTX’s Q-score but none of them are outstanding. This is why we stick to better alternatives in the sector and exclude RTX from our final 30-stock dividend growth portfolio.
[optin-monster slug=”ziwrnabndtepsyq0fyai”]


