PepsiCo (NASDAQ: PEP) is a food and beverage company that sells snacks, staple foods, and beverages globally. Its brands include many household names like Cheetos, Doritos, Quaker, Aquafina, Gatorade, Mountain Dew, and of course, Pepsi. PEP operates through seven segments organized by product lines and geographies:
- Frito-Lay North America includes branded food and snack businesses in the U.S. and Canada
- Quaker Foods North America includes cereal, rice, pasta and other branded food businesses in the U.S. and Canada
- PepsiCo Beverages North America includes beverage businesses in the United States and Canada
- Latin America includes all beverage, food and snack businesses in Latin America
- Europe includes all beverage, food and snack businesses in Europe
- Africa, Middle East and South Asia includes all beverage, food and snack businesses in the region
- Asia Pacific, Australia and New Zealand and China Region includes all beverage, food and snack businesses in the region
| Segment | 2020 Revenue (in billion USD) | Revenue % |
| PepsiCo Beverages North America | 22.56 | 32% |
| Frito-Lay North America | 18.19 | 26% |
| Europe | 11.92 | 17% |
| Latin America | 6.94 | 10% |
| Africa, Middle East and South Asia | 4.57 | 6% |
| Asia Pacific, Australia and New Zealand and China Region | 3.45 | 5% |
| Quaker Foods North America | 2.74 | 4% |
PepsiCo’s revenues are geographically diversified with 40% of sales coming from outside the U.S.
PepsiCo’s Dividend History and Payout Ratio
PEP has an excellent track record of paying and increasing dividends for 48 consecutive years, a record that the company will feel highly obligated to maintain. This dividend growth track record almost qualifies PepsiCo as a dividend king (a company that has a track record of increasing dividend payouts for more than 50 years), the most prestigious dividend growth category there is. With two years to go, PEP is sure to have this unique status in its sight.
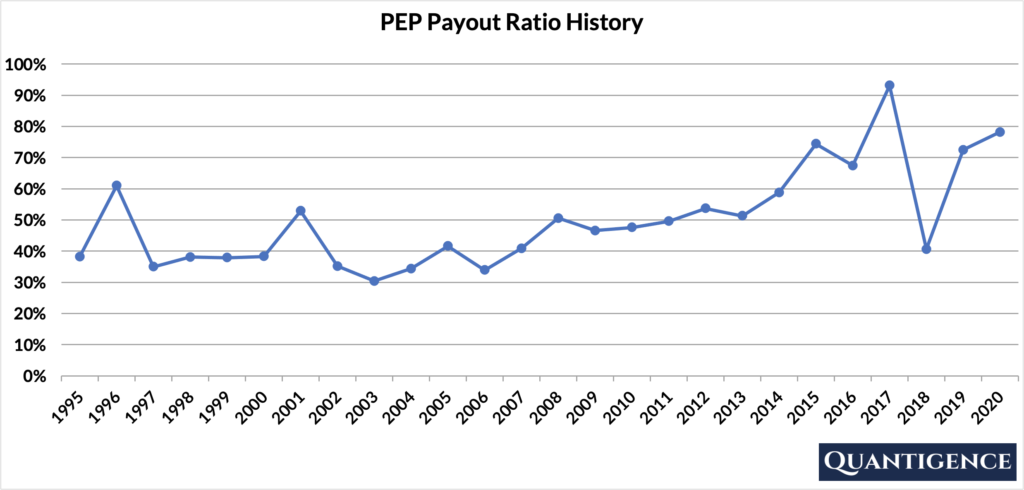
In 2020, PEP paid out 78% of its profits in the form of dividends. The company’s payout ratio history over the past 25 years looks relatively stable except for the past few years where we see increased volatility with an upward trend.

When Does PepsiCo Pay Dividends?
PEP pays a quarterly dividend typically announced on various dates in February, May, July, and November. The ex-dates are in March, June, September, and December, and payments are at the end of March, June, September, and the beginning of January.
What is PepsiCo’s Dividend Yield?
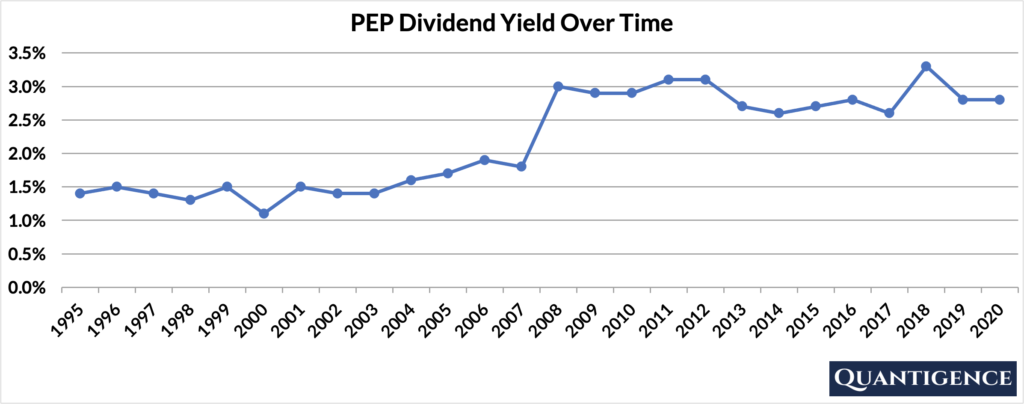
Dividend yield (the annual dividend paid divided by the share price) shows the 1-year return on a stock purchase in the form of dividends. In 2020, PEP had a dividend yield of 2.8%, higher than our investment universe average of 1.8%. The stock’s historical yield has been moving between 1.1% and 3.3% with an average of 2.2%.

PepsiCo’s Dividend Growth Rate
PEP has grown its dividend by an average of 7.8% every year for the past 10 years as well as the past five years, a consistent growth rate that’s not half bad, handily beating inflation. Below you can see the effect a 10-year growth rate of 7.8% has on PEP’s dividend assuming a starting yield of 2.8%.
| Years | Dividend Growth | Yield Calculation | Yield % |
| Year 0 | 0% | 2.80% | 2.8% |
| Year 1 | 7.80% | 2.8%*1.078 | 3.02% |
| Year 2 | 7.80% | 2.8%*(1.078)^2 | 3.25% |
| Year 3 | 7.80% | 2.8%*(1.078)^3 | 3.51% |
| Year 4 | 7.80% | 2.8%*(1.078)^4 | 3.78% |
| Year 5 | 7.80% | 2.8%*(1.078)^3 | 4.08% |
| Year 6 | 7.80% | 2.8%*(1.078)^6 | 4.39% |
| Year 7 | 7.80% | 2.8%*(1.078)^7 | 4.74% |
| Year 8 | 7.80% | 2.8%*(1.078)^8 | 5.11% |
| Year 9 | 7.80% | 2.8%*(1.078)^9 | 5.50% |
| Year 10 | 7.80% | 2.8%*(1.078)^10 | 5.93% |
If you bought PEP at a yield of 2.8%, an average 10-year dividend growth of 7.8% would mean your yield would be an impressive 5.93% 10 years from now. This is called “yield on cost,” and shows the yield you’re receiving on the original amount of money you invested.
How Strong is PepsiCo’s Dividend?
When evaluating dividend stocks, we use our own methodology which is based on Q-scores which consist of seven factors:
- Years paying and increasing dividends
- Market cap
- International sales
- Yield
- Payout ratio
- Five-year dividend growth rate
- Ten-year dividend growth rate
We calculate each of these factors and summarize them in a final proprietary Q-score. To learn more about how we calculate Q-scores, check out our piece on “7 Factors Used to Select Dividend Growth Stocks.”
The Q-score for PepsiCo is presently 17.9, the second-highest Q-score in the “Consumer Staples” sector and 10th highest overall Q-score in our dividend growth investment universe. We reward the company for its size and dividend growth track record. PEP’s yield, international sales, and five and 10-year dividend growth rates are also very good, so they contribute to the stock’s overall Q-score significantly. PEP’s payout ratio is mediocre and contributes little to the final Q-score.
PepsiCo is a great dividend growth stock by all accounts and has a place in any diversified DGI portfolio. The reason we’re not holding the stock is that we hold Coca-Cola (NYSE: KO), a direct competitor whose business overlaps with PepsiCo to a large extent. When we created our portfolio, we chose to hold Coca-Cola, the company that helped make Warren Buffet wealthy. Notwithstanding, PEP is also a great choice, and deciding between the two companies largely comes down to personal preference.
[optin-monster slug=”ziwrnabndtepsyq0fyai”]


