Target Corporation (NYSE: TGT) is a general merchandise retailer that operates in the United States only. The company offers food, apparel, accessories, home decor products, electronics, toys, seasonal offerings, and beauty and household essentials. It also provides in-store amenities, such as Target Cafe, Target Optical, Starbucks, and other food service offerings. The company sells its products through its stores; and digital channels, including Target.com. As of January 2021, the company operated approximately 1,897 stores.
TGT reports its financials in one single segment, but breaks out revenues by product groupings with sales relatively evenly distributed. Target is a consumer discretionary stock that is said to benefit when – as the name implies – consumers have more discretionary income. This may not always be the case though. Household essentials, food, and beverages are consumer staples, products that people need no matter what. These are typically thought of as defensive stocks that perform well when everything else goes to shite.
| Product Line | 2020 Revenue (in billion USD) | Revenue % |
| Apparel and accessories | 14.772 | 16% |
| Beauty and household essentials | 24.461 | 26% |
| Food and beverage | 18.135 | 20% |
| Hardlines (electronics, toys, entertainment, luggage) | 16.626 | 18% |
| Home furnishings and décor | 18.231 | 20% |
| Other (including credit card profit sharing income) | 0.175 | 0.2% |
TGT’s Dividend History and Payout Ratio
TGT has an excellent track record of paying and increasing dividends for 53 consecutive years, a record that the company will likely feel highly obligated to maintain. This dividend growth track record makes TGT a dividend king (a company that has a track record of increasing dividend payouts for more than 50 years), the most prestigious dividend growth category there is.
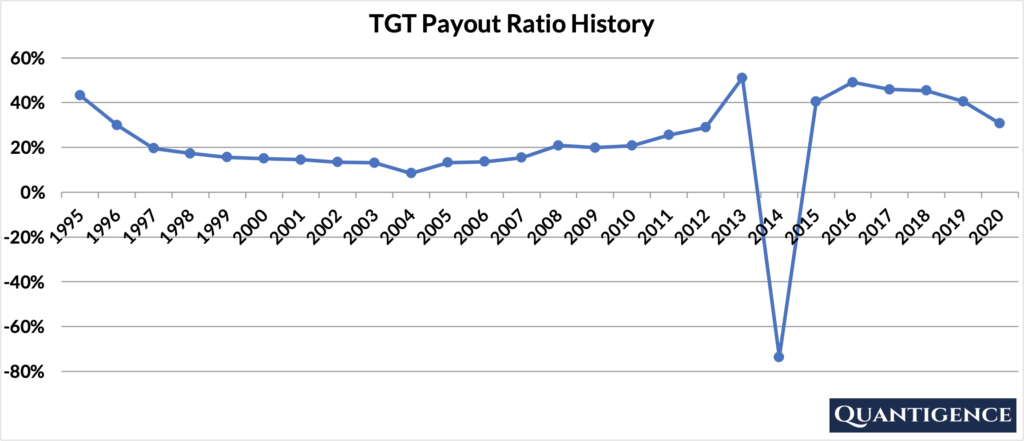
In 2020, TGT paid out only 30.7% of its profits in the form of dividends. This low payout ratio enables the company to keep growing its dividend in the future, even if earnings are not growing or temporarily declining. The company’s payout ratio history has been remarkably stable over the past 20 years with the exception of 2014.
In 2014, Target exited the Canadian market and its Canadian subsidiaries filed for creditor protection. This resulted in a single year of losses for the company.
When Does TGT Pay Dividends?
TGT pays a quarterly dividend typically announced on varied dates in January, March, June, and September. The ex-dates are around the middle of February, May, August, and November. Payments are made on the 10th day of the following months (March, June, September, and December).
What is TGT’s Dividend Yield?
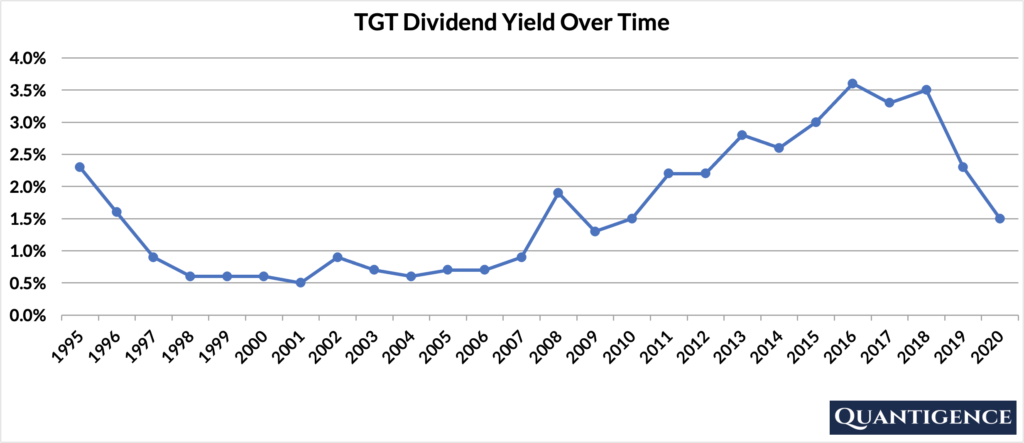
Dividend yield (the annual dividend paid divided by the share price) shows the 1-year return on a stock purchase in the form of dividends. In 2020, TGT had a dividend yield of 1.5%, below our investment universe average of 1.8%. The stock’s historical yield has been moving between 0.5% and 3.6% with an average of 1.7%.
TGT’s Dividend Growth Rate
TGT has grown its dividend payout by an average of 12.3% every year for the past 10 years. However, that growth seems to be slowing to a trickle lately with the annual dividend increase averaging 4.4% over the last five years. Below you can see the effect a 10-year growth rate of 12.3% has on TGT’s dividend assuming a starting yield of 1.5%.
| Years | Dividend Growth | Yield Calculation | Yield % |
| Year 0 | 0% | 1.50% | 1.5% |
| Year 1 | 12.30% | 1.5%*1.123 | 1.68% |
| Year 2 | 12.30% | 1.5%*(1.123)^2 | 1.89% |
| Year 3 | 12.30% | 1.5%*(1.123)^3 | 2.12% |
| Year 4 | 12.30% | 1.5%*(1.123)^4 | 2.39% |
| Year 5 | 12.30% | 1.5%*(1.123)^3 | 2.68% |
| Year 6 | 12.30% | 1.5%*(1.123)^6 | 3.01% |
| Year 7 | 12.30% | 1.5%*(1.123)^7 | 3.38% |
| Year 8 | 12.30% | 1.5%*(1.123)^8 | 3.79% |
| Year 9 | 12.30% | 1.5%*(1.123)^9 | 4.26% |
| Year 10 | 12.30% | 1.5%*(1.123)^10 | 4.79% |
If you bought TGT at a yield of 1.5%, an average 10-year dividend growth of 12.3% would mean your yield would be 4.79% 10 years from now. This is called “yield on cost,” and shows the yield we’re receiving on the original amount of money we invested.
How Strong is TGT’s Dividend?
When evaluating dividend stocks, we use our own methodology which is based on Q-scores which consist of seven factors:
- Years paying and increasing dividends
- Market cap
- International sales
- Yield
- Payout ratio
- Five-year dividend growth rate
- Ten-year dividend growth rate
We calculate each of these factors and summarize them in a final proprietary Q-score. To learn more about how we calculate Q-scores, check out our piece on “7 Factors Used to Select Dividend Growth Stocks.”
The Q-score for Target Corporation is presently 9.8, way below our investment universe average value of 13.1. This Q-score makes Target the fourth best consumer discretionary stock out of five. We reward TGT for its low payout ratio, its dividend growth track record, and its 10-year dividend growth rate. We penalize the stock for the lack of international sales and its low 5-year dividend growth rate. TGT’s market cap and yield are mediocre so they contribute very little.
As there are much better consumer discretionary stocks out there (sideways glance towards McDonald’s) we do not include Target in our final dividend growth stock portfolio.
[optin-monster slug=”ziwrnabndtepsyq0fyai”]