T. Rowe Price Group (NASDAQ: TROW) is a publicly traded investment manager that provides its services to individuals, institutional investors, retirement plans, financial intermediaries, and other institutions. TROW creates and manages equity and fixed income mutual funds that invest across the globe, also making investments in late-stage venture capital transactions, usually between $3 million and $5 million.
TROW doesn’t break out its operations into business segments or geographies, so we can’t really tell where their revenues are coming from. To see how geographically diversified the business is, we can look at the company’s revenues from products other than U.S. Mutual Funds which amount to 31%.
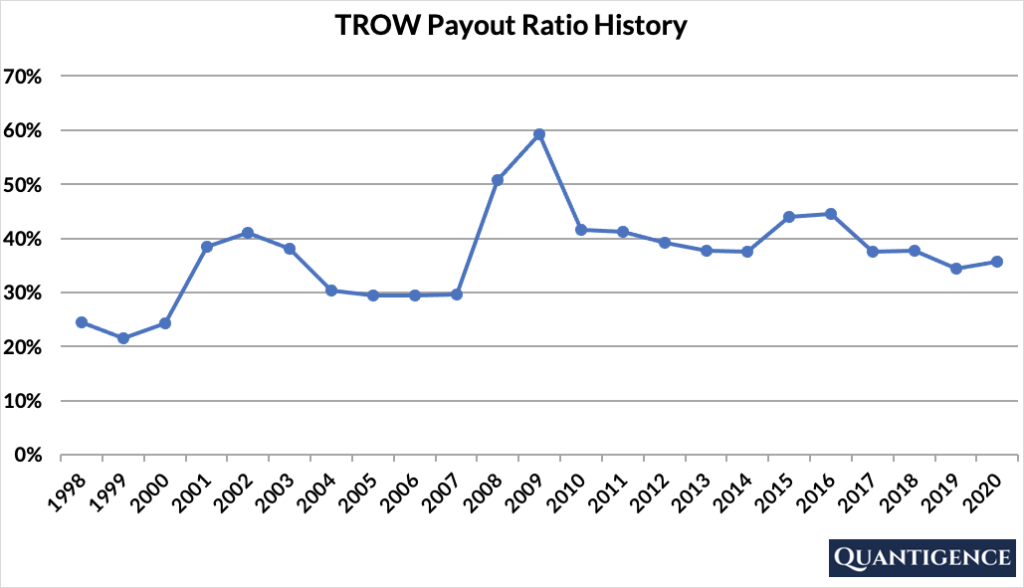
TROW’s Dividend History and Payout Ratio
TROW has been paying and increasing dividends for 35 consecutive years, a track record that the company will likely feel highly obligated to maintain. In 2020, the company paid out only 36% of its profits in the form of dividends. This low payout ratio enables the company to keep growing its dividend in the future, even if earnings are not growing or temporarily declining. The company’s payout ratio history over the past 20 years has been remarkably stable with the exception of 2008-2009, the peak of the financial crisis.
When Does TROW Pay Dividends?
TROW pays a quarterly dividend typically announced in the second half of February, April, August, and October. The ex-dates are around the middle of March, June, September, and December and payments are made at the end of the same months.
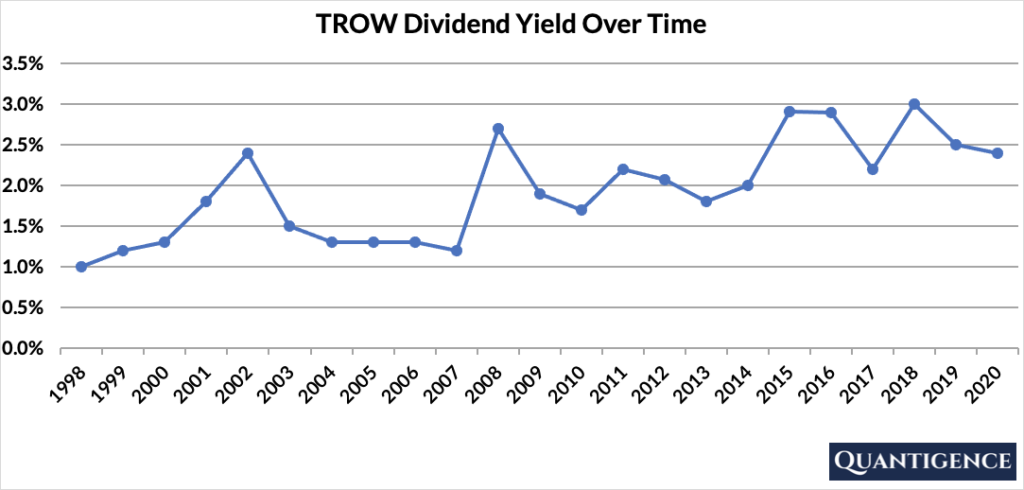
What is TROW’s Dividend Yield?
Dividend yield (the annual dividend paid divided by the share price) shows the 1-year return on a stock purchase in the form of dividends. In 2020, TROW had a dividend yield of 2.4%, somewhat higher than our investment universe average of 1.8%. The stock’s historical yield has been moving between 1.0% and 3.0% with an average of 1.9%.
Please note that we have excluded special dividends paid by TROW in our payout ratio and yield charts, as well as our Q-score calculation. We aim to gauge the sustainable strength of TROW’s dividend and one-off special payouts skew the long-term outlook. The two excluded special dividend payouts, both of which are substantial, are as follows:
- $2 per share paid in 2015
- $1 per share paid in 2012
TROW’s Dividend Growth Rate
TROW has grown its dividend payout by an average of 12.8% every year for the past 10 years. That growth seems to be slowing a tiny bit lately with the annual dividend increase averaging 11.6% over the last five years, a growth number that’s still excellent. Below you can see the effect a 10-year growth rate of 12.8% has on TROW’s dividend assuming a starting yield of 2.4%.
| Years | Dividend Growth | Yield Calculation | Yield % |
| Year 0 | 0% | 2.40% | 2.4% |
| Year 1 | 12.80% | 2.4%*1.128 | 2.71% |
| Year 2 | 12.80% | 2.4%*(1.128)^2 | 3.05% |
| Year 3 | 12.80% | 2.4%*(1.128)^3 | 3.44% |
| Year 4 | 12.80% | 2.4%*(1.128)^4 | 3.89% |
| Year 5 | 12.80% | 2.4%*(1.128)^3 | 4.38% |
| Year 6 | 12.80% | 2.4%*(1.128)^6 | 4.94% |
| Year 7 | 12.80% | 2.4%*(1.128)^7 | 5.58% |
| Year 8 | 12.80% | 2.4%*(1.128)^8 | 6.29% |
| Year 9 | 12.80% | 2.4%*(1.128)^9 | 7.10% |
| Year 10 | 12.80% | 2.4%*(1.128)^10 | 8.00% |
If you bought TROW at a yield of 2.4%, an average 10-year dividend growth of 12.8% would mean your yield would be an impressive 8.0% 10 years from now. This is called “yield on cost,” and shows the yield we’re receiving on the original amount of money we invested.
How Strong is TROW’s Dividend?
When evaluating dividend stocks, we use our own methodology which is based on Q-scores which consist of seven factors:
- Years paying and increasing dividends
- Market cap
- International sales
- Yield
- Payout ratio
- Five-year dividend growth rate
- Ten-year dividend growth rate
We calculate each of these factors and summarize them in a final proprietary Q-score. To learn more about how we calculate Q-scores, check out our piece on “7 Factors Used to Select Dividend Growth Stocks.”
The Q-score for T. Rowe Price Group is presently 16.4, the fourth highest Q-score among nine dividend champions in the financial sector. TROW’s payout ratio and five-year / 10-year dividend growth rates are exceptional, so these factors are rewarded. The company’s dividend growth track record, international sales, and yield are okay, so they contribute to the final Q-score a bit less. With a market cap of $34 billion, TROW’s size is on the lower end of our investment universe so it contributes very little to the final Q-score.
TROW is a solid dividend growth stock that wasn’t selected into our final 30-stock portfolio because it’s competing with financial companies with even better Q-scores.
[optin-monster slug=”ziwrnabndtepsyq0fyai”]