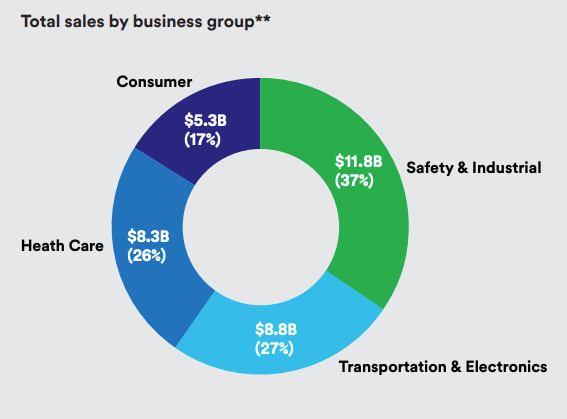
Who would have known that 3M Company (NYSE: MMM) could become a $113 billion company just by selling those ubiquitous Post-it sticky notes? We’re kidding of course. MMM is actually an industrial conglomerate that develops, manufactures, and markets a variety of products in four business segments:
- Safety and Industrial offers personal safety products, industrial adhesives and tapes, abrasives, closure and masking systems, electrical markets, automotive aftermarket, and roofing granules to industrial, electrical, and safety markets.
- Transportation and Electronics provides display materials and systems, electronic materials solutions, automotive and aerospace, advanced materials, and transportation safety products
- Health Care offers medical and surgical supplies, skin health and infection prevention products, oral care, separation and purification sciences, health information systems, drug delivery systems, and food safety products
- Consumer provides home improvement, home care, and consumer health care products, as well as stationery and office supplies. This segment is also involved in the retail auto care business.
The great thing about a conglomerate is that it’s a collection of unrelated businesses across various industries. This provides a diversification effect that helps protect against volatility of cyclical industries and the broader overall economy.
MMM’s revenues are well diversified geographically (59% of sales comes from outside the U.S.) and between its four segments.
MMM’s Dividend History and Payout Ratio
3M has an excellent track record of paying and increasing dividends for 63 consecutive years, a record that the company will likely feel highly obligated to maintain. This dividend growth track record makes 3M a dividend king (a company that has a track record of increasing dividend payouts for more than 50 years), the most prestigious dividend growth category there is.
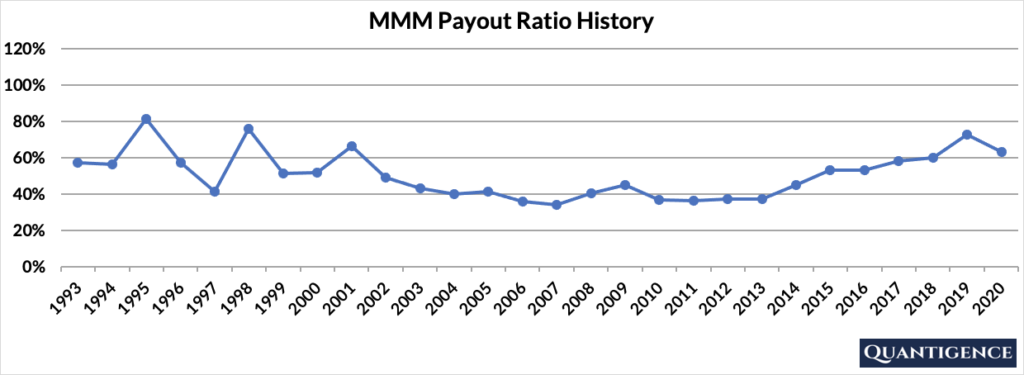
In 2020, 3M paid out only 63% of its profits in the form of dividends. This low payout ratio enables the company to keep growing its dividend in the future, even if earnings are not growing or temporarily declining. In looking at the company’s payout ratio history over the past 20 years, it’s been remarkably stable.
When Does MMM Pay Dividends?
MMM pays a quarterly dividend typically announced in the first half of February, May, August, and November. The ex-dates are a week after the announcement dates and payments are made on the 12th day of the following months (March, June, September, and December).
What is MMM’s Dividend Yield?
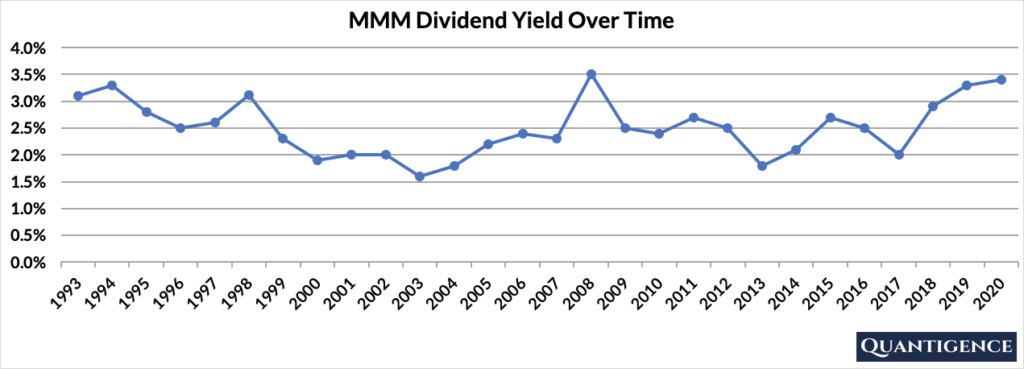
Dividend yield (the annual dividend paid divided by the share price) shows the 1-year return on a stock purchase in the form of dividends. In 2020, MMM had a dividend yield of 3.4%, close to double the value of our investment universe average of 1.8%. The stock’s historical yield has been moving between 1.5% and 3.5% with an average of 2.5%.
MMM’s Dividend Growth Rate
MMM has grown its dividend payout by an average of 10.8% every year for the past 10 years. However, that growth seems to be slowing lately with the annual dividend increase averaging 7.5% over the last five years, a growth number that’s still not half bad. Below you can see the effect a 10-year growth rate of 10.8% has on MMM’s dividend assuming a starting yield of 3.4%.
| Years | Dividend Growth | Yield Calculation | Yield % |
| Year 0 | 0% | 3.40% | 3.4% |
| Year 1 | 10.80% | 3.4%*1.108 | 3.77% |
| Year 2 | 10.80% | 3.4%*(1.108)^2 | 4.17% |
| Year 3 | 10.80% | 3.4%*(1.108)^3 | 4.62% |
| Year 4 | 10.80% | 3.4%*(1.108)^4 | 5.12% |
| Year 5 | 10.80% | 3.4%*(1.108)^3 | 5.68% |
| Year 6 | 10.80% | 3.4%*(1.108)^6 | 6.29% |
| Year 7 | 10.80% | 3.4%*(1.108)^7 | 6.97% |
| Year 8 | 10.80% | 3.4%*(1.108)^8 | 7.72% |
| Year 9 | 10.80% | 3.4%*(1.108)^9 | 8.56% |
| Year 10 | 10.80% | 3.4%*(1.108)^10 | 9.48% |
If you bought MMM at a yield of 3.4%, an average 10-year dividend growth of 10.8% would mean your yield would be an impressive 9.48% 10 years from now. This is called “yield on cost,” and shows the yield we’re receiving on the original amount of money we invested.
How Strong is MMM’s Dividend?
When evaluating dividend stocks, we use our own methodology which is based on Q-scores which consist of seven factors:
- Years paying and increasing dividends
- Market cap
- International sales
- Yield
- Payout ratio
- Five-year dividend growth rate
- Ten-year dividend growth rate
We calculate each of these factors and summarize them in a final proprietary Q-score. To learn more about how we calculate Q-scores, check out our piece on “7 Factors Used to Select Dividend Growth Stocks.”
The Q-score for 3M Company is presently 20.4, the second-highest Q-score in our dividend growth investment universe, and the top score in our final portfolio. (The 2021 leader in Q-score was Enbridge, an oil & gas newcomer with an unsustainably high yield, so we decided not to include it in the final Quantigence portfolio.)
If you were going to invest in one stock in the entire universe of dividend growth stocks and JNJ wasn’t available, it would have to be 3M. We love to invest in conglomerates because they are collections of businesses that cross multiple industries and provide a built-in form of diversification. MMM gets rewards for all seven factors we use to compile the final Q-score and takes the top position in our 30-stock dividend growth portfolio.
[optin-monster slug=”ziwrnabndtepsyq0fyai”]