Cincinnati Financial Corporation (NASDAQ: CINF), together with its subsidiaries, provides property casualty insurance products in the United States only. The company operates through five segments:
- Commercial Lines Insurance: provides coverage to businesses against third-party liability from accidents, damages to property, damages to vehicles, and government-specified benefits from work-related injuries to employees
- Personal Lines Insurance: provides personal home and auto coverage
- Excess and Surplus Lines Insurance: covers business risks with unique characteristics, such as the nature of the business or its claim history, that are difficult to profitably insure in the standard commercial lines market
- Life Insurance: offers life insurance policies for specific terms and indefinite periods
- Investments: covers income and capital gains on CINF’s investment portfolio
Almost half of all revenues are generated by CINF’s Commercial Insurance segment.
| Segment | 2020 Revenue (in billion USD) | Revenue % |
| Commercial Lines Insurance | 3.476 | 46% |
| Personal Lines Insurance | 1.463 | 19% |
| Excess and Surplus Lines Insurance | 0.325 | 4% |
| Life Insurance | 0.289 | 4% |
| Investments (2020 income and gains) | 1.535 | 20% |
| Cincinnati Re (subsidiary) | 0.302 | 4% |
| Cincinnati Global (subsidiary) | 0.177 | 2% |
CINF’s Dividend History and Payout Ratio
CINF has an excellent track record of paying and increasing dividends for 61 consecutive years, a record that the company will likely feel highly obligated to maintain. This dividend growth track record makes CINF a dividend king (a company that has a track record of increasing dividend payouts for more than 50 years), the most prestigious dividend growth category there is.
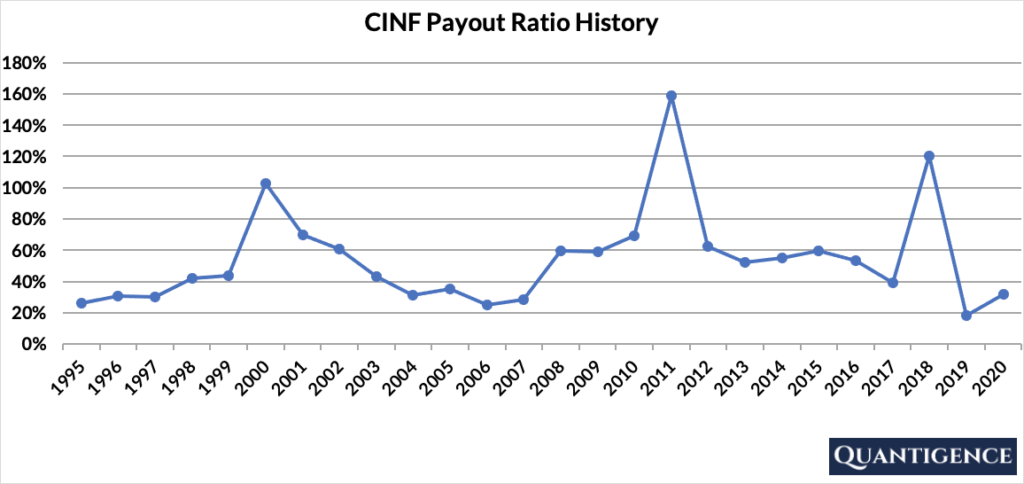
As of the end of 2020, CINF paid out only 32% of its profits in the form of dividends. This low payout ratio still leaves the company ample room to continue increasing its dividend in the future. In looking at the company’s payout ratio history seen below, it’s been quite volatile over the past 25 years.

The volatility seen above was caused by fluctuations in Cincinnati Financial’s earnings. The three years where CINF had to pay more dividends than the amount of profits it generated were 2018, 2011, and 2000. Here’s what happened in each of these three years:
- 2018: CINF incurred heavy investment losses
- 2011: CINF incurred high insurance losses and paid higher policyholder benefits than usual
- 2000: CINF incurred heavy investment losses
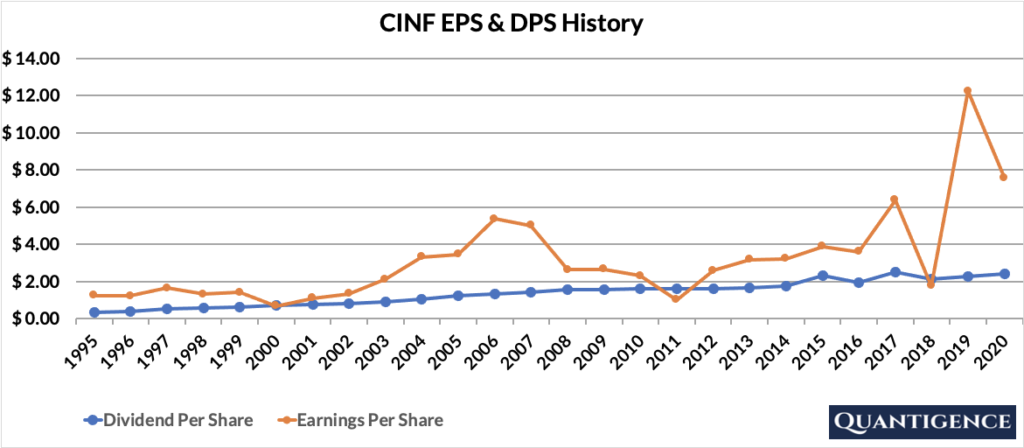
The company’s earnings per share (EPS) and dividend per share (DPS) history below breaks down CINF’s payout ratio to its two components. In the years where EPS dips below DPS the payout ratio spikes above 100%.

The EPS spiked significantly in 2019 as seen in the above chart. That’s because Cincinnati Financial had a great year in 2019 thanks to unusually high investment returns. This increased its earnings sharply consequently decreasing its payout ratio to a historic low.
When Does CINF Pay Dividends?
CINF pays a quarterly dividend typically announced in January, May, August, and November. The ex-dates are around the middle of March, June, September, and December. Payments are made in the middle of the following months (April, July, October, and January).
What is CINF’s Dividend Yield?
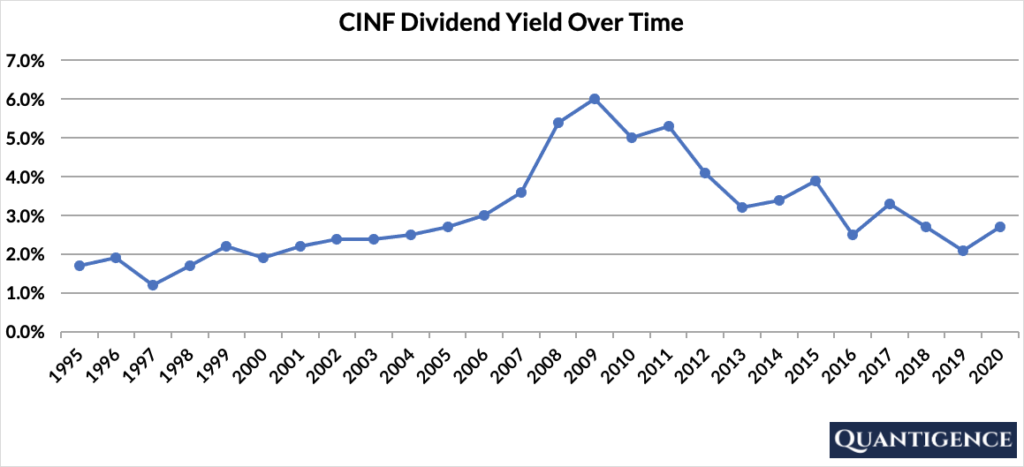
Dividend yield (the annual dividend paid divided by the share price) shows the 1-year return on a stock purchase in the form of dividends. As of the end of 2020, CINF had a dividend yield of 2.7%, significantly higher than our investment universe average of 1.8%. The stock’s historical yield peaked in 2019 following the financial crisis and has settled between 2% and 3% since then.

CINF’s Dividend Growth Rate
CINF has increased its dividend payout by an average of 4.2% every year for the past 10 years. However, that number seems to be increasing lately with the annual average dividend increase averaging 5.4% over the last five years. Below you can see the effect a 10-year growth rate of 4.20% has on CINF’s dividend assuming a starting yield of 2.7%.
| Years | Dividend Growth | Yield Calculation | Yield % |
| Year 0 | 0% | 2.7% | 2.7% |
| Year 1 | 4.20% | 2.7%*1.042 | 2.81% |
| Year 2 | 4.20% | 2.7%*(1.042)^2 | 2.93% |
| Year 3 | 4.20% | 2.7%*(1.042)^3 | 3.05% |
| Year 4 | 4.20% | 2.7%*(1.042)^4 | 3.18% |
| Year 5 | 4.20% | 2.7%*(1.042)^5 | 3.32% |
| Year 6 | 4.20% | 2.7%*(1.042)^6 | 3.46% |
| Year 7 | 4.20% | 2.7%*(1.042)^7 | 3.60% |
| Year 8 | 4.20% | 2.7%*(1.042)^8 | 3.75% |
| Year 9 | 4.20% | 2.7%*(1.042)^9 | 3.91% |
| Year 10 | 4.20% | 2.7%*(1.042)^10 | 4.07% |
If you bought CINF at a yield of 2.7%, an average 10-year dividend growth of 4.2% would mean our yield would be 4.07% 10 years from now. This is called “yield on cost,” and shows the yield if the original amount of money invested in the stock remained constant.
How Strong is EMR’s Dividend?
When evaluating dividend stocks, we use our own methodology which is based on Q-scores which consist of seven factors:
- Years paying and increasing dividends
- Market cap
- International sales
- Yield
- Payout ratio
- Five-year dividend growth rate
- Ten-year dividend growth rate
We calculate each of these factors and summarize them in a final proprietary Q-score. To learn more about how we calculate Q-scores, check out our piece on “7 Factors Used to Select Dividend Growth Stocks.”
The Q-score for Cincinnati Financial Corporation is presently 11.2, below our dividend growth portfolio average of 14.6. CINF’s dividend growth track record and payout ratio are excellent, so these factors are rewarded. Market cap, yield, and both dividend growth rates are mediocre, so these contribute less to the overall Q-score. CINF only operates in the U.S. so the international sales component is penalized.
Cincinnati Financial is the sixth company out of nine dividend champions in the Financials sector. We have better alternatives to choose from with higher Q-scores, so we do not include CINF in our final 30-stock dividend growth portfolio.
[optin-monster slug=”ziwrnabndtepsyq0fyai”]


