Emerson Electric (NYSE: EMR) designs and manufactures technology and engineering products for industrial, commercial, and consumer markets worldwide. It operates through two segments: Automation Solutions and Commercial & Residential Solutions. The Automation Solutions segment offers measurement and analytical instrumentation, industrial valves and equipment, and process control software and systems. The Commercial & Residential Solutions segment offers residential and commercial heating and air conditioning products, monitoring equipment and electronic controls for gas and electric heating systems, sensors and thermistors for home appliances, and temperature sensors and controls.
EMR’s revenues are diversified geographically with more than half of sales coming from outside the US, and between its two segments, Automation Solutions (two thirds) and Commercial & Residential Solutions (one third). Earnings distribution between the two segments is closer to 50-50.
| Segment | 2020 Revenue (in billion USD) | 2020 Earnings (in billion USD) | Revenue % | Earnings % |
| Automation Solutions | 11.16 | 1.52 | 66% | 58% |
| Commercial & Residentail Solutions | 5.64 | 1.12 | 34% | 42% |
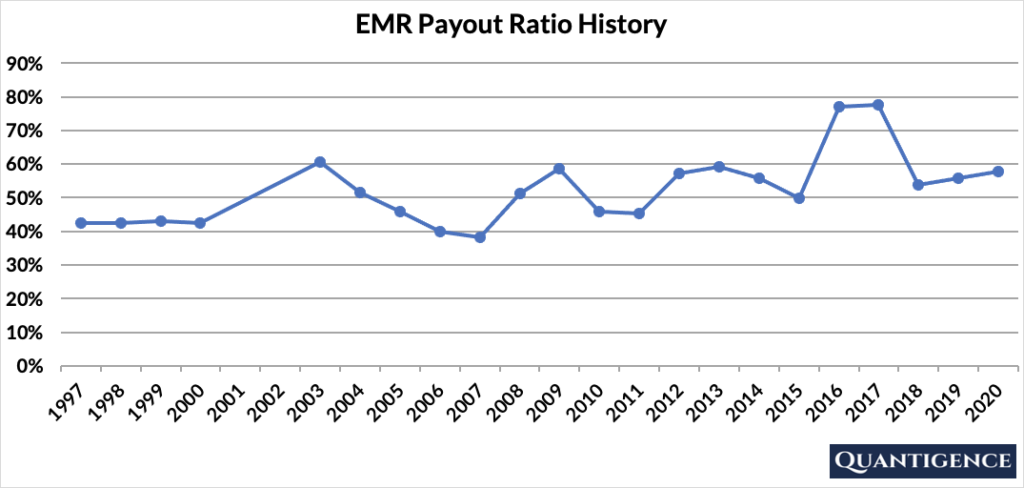
EMR’s Dividend History and Payout Ratio
EMR has an excellent track record of paying and increasing dividends for 64 consecutive years, a record that the company will likely feel highly obligated to maintain. This dividend growth track record makes EMR a dividend king (a company that has a track record of increasing dividend payouts for more than 50 years), the most prestigious dividend growth category there is.
As of the end of 2020, EMR paid out 58% of its profits in the form of dividends. The company’s payout ratio shows a slow steady increase over the past 20 years from around 40% to above 50%. This still leaves the company ample room to continue increasing its dividend.
When Does EMR Pay Dividends?
EMR pays a quarterly dividend typically announced in the first week of February, May, August, and November. The ex-dates are around the middle of the same month and payments are made around the 10th of the following month (March, June, September, and December). The precise days may differ from each year to the next as these dates are always set to working days.
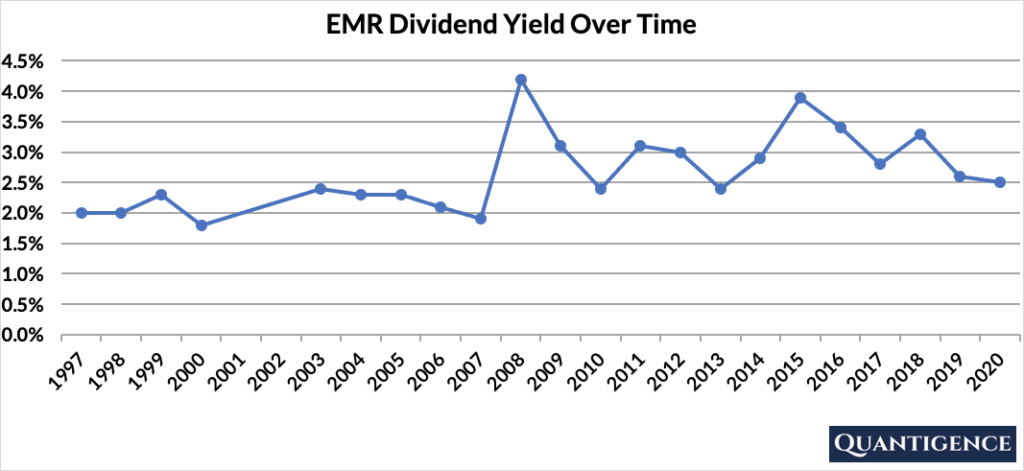
What is EMR’s Dividend Yield?
Dividend yield (the annual dividend paid divided by the share price) shows the 1-year return on a stock purchase in the form of dividends. As of the end of 2020, EMR had a dividend yield of 2.5%, higher than our investment universe average of 1.8%. The stock’s historical yields fluctuate around an average of 2.8%.
EMR’s Dividend Growth Rate
EMR has increased its dividend payout by an average of 4.0% every year for the past 10 years. However, dividend increases have slowed to an annual average of only 1.2% in the past five years. Below you can see the effect a 10-year growth rate of 4.0% has on EMR’s dividend assuming a starting yield of 2.5%.
| Years | Dividend Growth | Yield Calculation | Yield % |
| Year 0 | 0% | 2.5% | 2.5% |
| Year 1 | 4.00% | 2.5%*1.04 | 2.60% |
| Year 2 | 4.00% | 2.5%*(1.04)^2 | 2.70% |
| Year 3 | 4.00% | 2.5%*(1.04)^3 | 2.81% |
| Year 4 | 4.00% | 2.5%*(1.04)^4 | 2.92% |
| Year 5 | 4.00% | 2.5%*(1.04)^5 | 3.04% |
| Year 6 | 4.00% | 2.5%*(1.04)^6 | 3.16% |
| Year 7 | 4.00% | 2.5%*(1.04)^7 | 3.29% |
| Year 8 | 4.00% | 2.5%*(1.04)^8 | 3.42% |
| Year 9 | 4.00% | 2.5%*(1.04)^9 | 3.56% |
| Year 10 | 4.00% | 2.5%*(1.04)^10 | 3.70% |
If you bought EMR at a yield of 2.5%, an average 10-year dividend growth of 4.0% would mean our yield would be 3.7% 10 years from now. This is called “yield on cost,” and shows the yield if the original amount of money invested in the stock remained constant.
How Strong is EMR’s Dividend?
When evaluating dividend stocks, we use our own methodology which is based on Q-scores which consist of seven factors:
- Years paying and increasing dividends
- Market cap
- International sales
- Yield
- Payout ratio
- Five-year dividend growth rate
- Ten-year dividend growth rate
We calculate each of these factors and summarize them in a final proprietary Q-score. To learn more about how we calculate Q-scores, check out our piece on “7 Factors Used to Select Dividend Growth Stocks.”
The Q-score for Emerson Electric is presently 14.3, a hair below our dividend growth portfolio average of 14.6. EMR’s dividend growth track record and international sales ratio are excellent, so these factors are rewarded. Market cap, yield, payout ratio, and 10-year dividend growth are fine but not outstanding, so these contribute less to the overall Q-score. EMR’s five-year dividend growth is low and we penalize them for that.
Emerson Electric takes the tenth position by overall Q-score out of 16 companies in the Industrials sector so it is not included in our final 30-stock dividend growth portfolio.
[optin-monster slug=”ziwrnabndtepsyq0fyai”]