Procter & Gamble (NYSE: PG) is one of the most notorious dividend growth stocks out there. The company provides branded consumer packaged goods to consumers across the globe, operating in five segments: Beauty, Grooming, Health Care, Fabric & Home Care, and Baby, Feminine & Family Care.
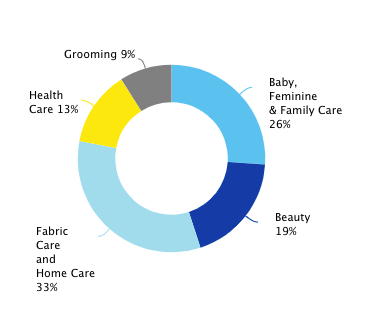
The company’s revenues are well-diversified among its segments as well as geographically (55% of sales come from international markets). It is also the third largest dividend growth company in our universe of 72 stocks.
PG’s Dividend History and Payout Ratio
PG has been paying and increasing dividends for 64 consecutive years, a great track record on all counts. This history of 50+ years of consecutive increases makes it a dividend king, the most prestigious dividend growth category there is. As of the end of 2020, PG paid out 57% of its profits to shareholders in the form of dividends. A payout ratio this low means there’s enough room for PG to increase its dividend even if earnings aren’t growing. The history of PG’s payout ratio is balanced and relatively flat around 50% (with an average of 56%).
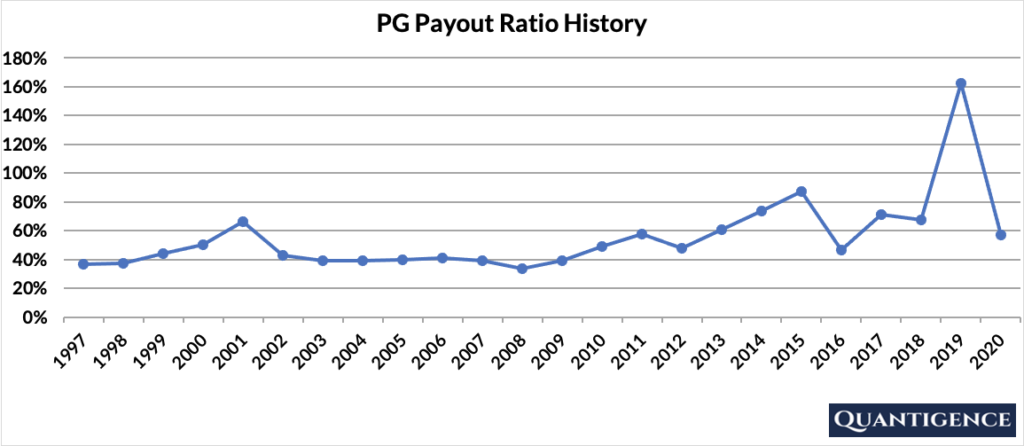
The spike you see in 2019 happened because the company re-valued its goodwill and other intangible assets related to its Gillette brand. This one-time non-cash item decreased operating income by $8.3 billion, or 60% at the time.
When Does PG Pay Dividends?
PG pays a quarterly dividend usually announced in the second week of January, April, July, and October. The ex-dates are in the third week of the month of announcement and payments are made in the middle of each of the months following the ex-dates (February, May, August, and November). The precise days may differ from each year to the next as these dates are always set to working days.
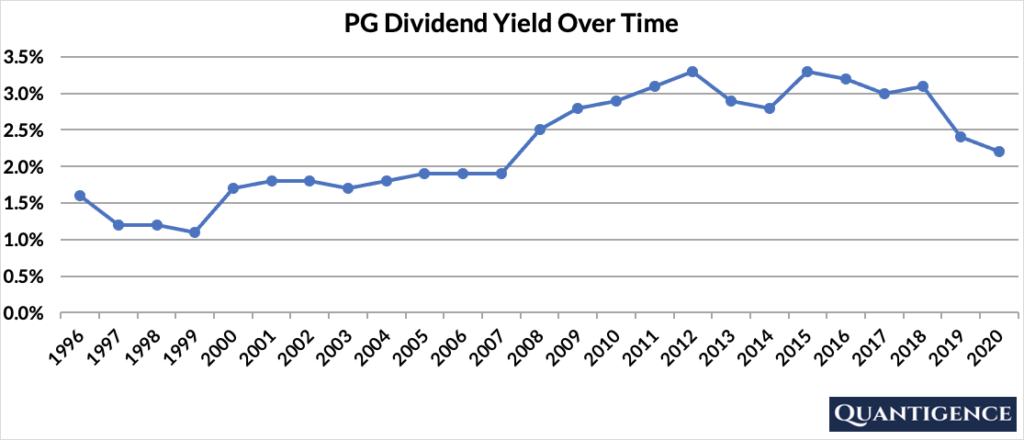
What is PG’s Dividend Yield?
As of the end of 2020, PG had a dividend yield of 2.2%, higher than the 1.8% average of our investment universe of US dividend champions. This means the annual dividend paid by PG was 2.2% of its share price at the time. The stock’s yield hovered around 3% over the past decade, 1 percentage point higher than in the period 2000-2010.
PG’s Dividend Growth Rate
PG has increased its dividend payout by an average of 5.2% every year for the past 10 years. However, dividend increases have slowed to an annual average of 3.4% in the past five years. Below you can see the effect a 10-year growth rate of 5.2% has on PG’s dividend assuming a starting yield of 2.2%
| Years | Dividend Growth | Yield Calculation | Yield % |
| Year 0 | 0% | 2.20% | 2.2% |
| Year 1 | 5.20% | 2.2%*1.052 | 2.31% |
| Year 2 | 5.20% | 2.2%*(1.052)^2 | 2.43% |
| Year 3 | 5.20% | 2.2%*(1.052)^3 | 2.56% |
| Year 4 | 5.20% | 2.2%*(1.052)^4 | 2.69% |
| Year 5 | 5.20% | 2.2%*(1.052)^5 | 2.83% |
| Year 6 | 5.20% | 2.2%*(1.052)^6 | 2.98% |
| Year 7 | 5.20% | 2.2%*(1.052)^7 | 3.14% |
| Year 8 | 5.20% | 2.2%*(1.052)^8 | 3.30% |
| Year 9 | 5.20% | 2.2%*(1.052)^9 | 3.47% |
| Year 10 | 5.20% | 2.2%*(1.052)^10 | 3.65% |
If you bought PG at a yield of 2.2%, an average 10-year dividend growth of 5.2% would mean our yield would be 3.65% 10 years from now. This is called “yield on cost,” and shows the yield if the original amount of money invested in the stock remained constant.
How Strong is PG’s Dividend?
When evaluating dividend stocks, we use our own methodology which is based on Q-scores which consist of seven factors:
- Years paying and increasing dividends
- Market cap
- International sales
- Yield
- Payout ratio
- Five-year dividend growth rate
- Ten-year dividend growth rate
We calculate each of these factors and summarize them in a final proprietary Q-score. To learn more about how we calculate Q-scores, check out our piece on “7 Factors Used to Select Dividend Growth Stocks.”
The Q-score for Procter & Gamble is currently 18.4, the sixth best in our investment universe and fifth best in the current Quantigence portfolio. We reward the company for its size, internationally diversified business, and dividend growth track record. PG’s yield, payout ratio, and 10-year dividend growth rate are fine so they contribute to the overall Q-score to a smaller extent. Recently slowing dividend growth reflected in the five-year growth rate receives a penalty.
All in all, PG is a stable Consumer Staples company thanks to its size, and business (everyone needs their products irrespective of market conditions) and a fine addition to any dividend growth portfolio.
[optin-monster slug=”ziwrnabndtepsyq0fyai”]