Genuine Parts Company (NYSE: GPC), founded in 1928, is a global service organization engaged in the distribution of automotive and industrial replacement parts. In addition, the company provides various services and repairs for both automotive and industrial machinery. The company operates in North America, Europe, Australia, New Zealand, Indonesia, and Singapore serving hundreds of thousands of customers from a network of more than 10,000 locations with over 50,000 employees.
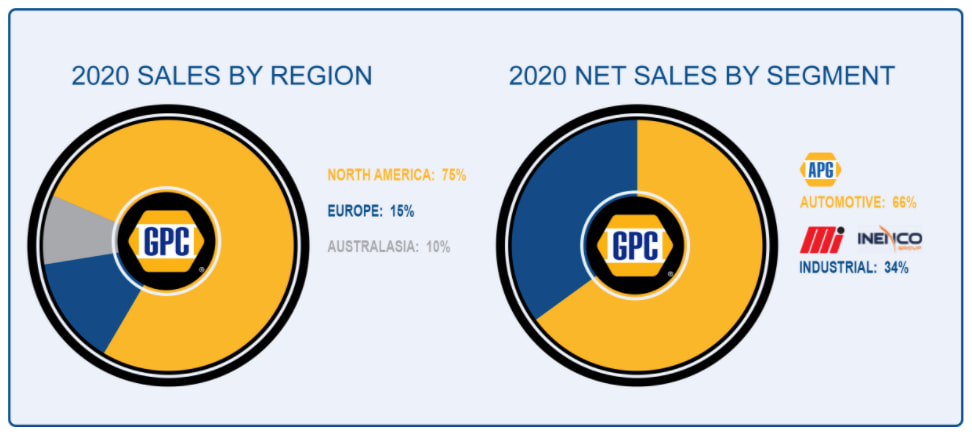
GPC’s revenues are diversified geographically with one third of sales coming from outside the US, and between its two divisions – Automotive (66%) and Industrial (34%). This makes the company more resilient in times of market turmoil.
GPC’s Dividend History and Payout Ratio
GPC has an excellent track record of paying and increasing dividends for 65 consecutive years, a record that the company will likely feel highly obligated to maintain. This dividend growth track record makes GPC a dividend king (a company that has a track record of increasing dividend payouts for more than 50 years), the most prestigious dividend growth category there is.
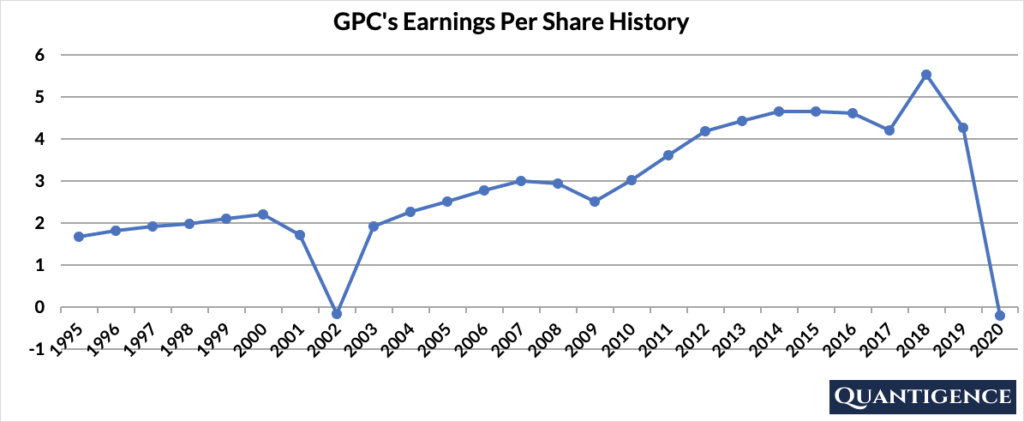
GPC’s earnings per share shows a steady increase over the past 25 years with the exception of 2002 and 2020. Both of these years, the company performed an audit of its goodwill assets and decreased their value. In 2002 the reason was a one-off change in accounting principles. In 2020, it was the business environment thanks to the COVID-19 pandemic. These non-cash impairment charges resulted in lossmaking years.
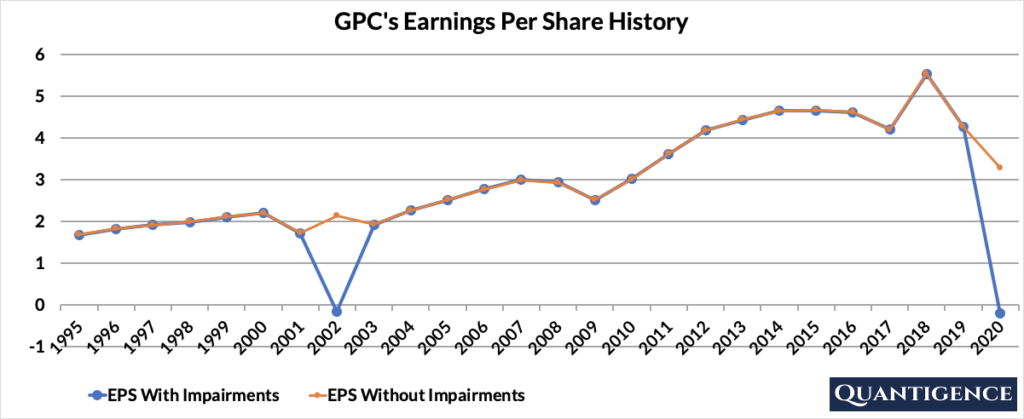
Given the one-off, non-cash nature of these impairments, we also calculated GPC’s earnings per share and payout ratio without these charges. These modified values paint a better picture of the company’s on-going business performance. The below chart shows our modified EPS values in orange compared to the original EPS values in blue.
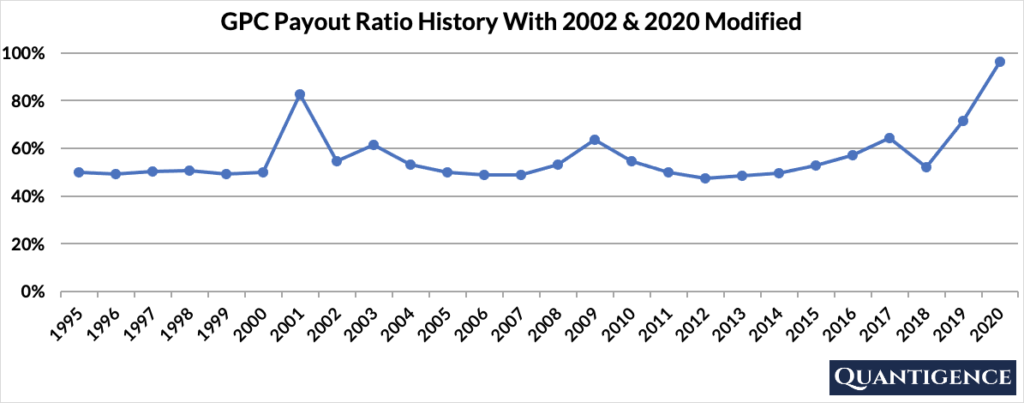
The below chart shows GPC’s payout ratio history with 2002 and 2020 values modified and one-off impairments added back. As you can see below, as of the end of 2020, GPC paid out 96% of its profits to shareholders in the form of dividends – almost all of its profits even without the one-off charges.
When Does GPC Pay Dividends?
GPC pays a quarterly dividend typically announced in the third week of February, April, August, and November. The ex-dates are usually in the first week of the following month and payments are made in the first days two months later (April, July, October, and January). The precise days may differ from each year to the next as these dates are always set to working days.
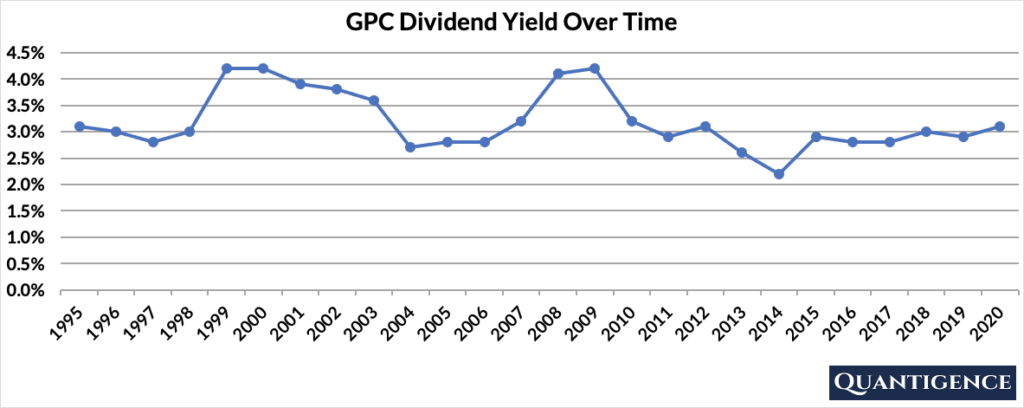
What is GPC’s Dividend Yield?
Dividend yield – the annual dividend paid divided by the share price – shows the 1-year return on a stock purchase in the form of dividends. As of the end of 2020, GPC had a dividend yield of 3.1%. This value is above the 1.8% average of our investment universe of US dividend champions. The stock’s yield history has been remarkably stable over the past 25 years with an average of 3.3%.
GPC’s Dividend Growth Rate
GPC has increased its dividend payout by an average of 6.8% every year for the past 10 years. However, dividend increases have slowed to an annual average of 5.1% in the past five years. Below you can see the effect a 10-year growth rate of 6.8% has on GPC’s dividend assuming a starting yield of 3.1%
| Years | Dividend Growth | Yield Calculation | Yield % |
| Year 0 | 0% | 3.1% | 3.1% |
| Year 1 | 6.80% | 3.1%*1.068 | 3.31% |
| Year 2 | 6.80% | 3.1%*(1.068)^2 | 3.54% |
| Year 3 | 6.80% | 3.1%*(1.068)^3 | 3.78% |
| Year 4 | 6.80% | 3.1%*(1.068)^4 | 4.03% |
| Year 5 | 6.80% | 3.1%*(1.068)^5 | 4.31% |
| Year 6 | 6.80% | 3.1%*(1.068)^6 | 4.60% |
| Year 7 | 6.80% | 3.1%*(1.068)^7 | 4.91% |
| Year 8 | 6.80% | 3.1%*(1.068)^8 | 5.25% |
| Year 9 | 6.80% | 3.1%*(1.068)^9 | 5.60% |
| Year 10 | 6.80% | 3.1%*(1.068)^10 | 5.99% |
If you bought GPC at a yield of 3.1%, an average 10-year dividend growth of 6.8% would mean our yield would be 5.99% 10 years from now. This is called “yield on cost,” and shows the yield if the original amount of money invested in the stock remained constant.
How Strong is GPC’s Dividend?
When evaluating dividend stocks, we use our own methodology which is based on Q-scores which consist of seven factors:
- Years paying and increasing dividends
- Market cap
- International sales
- Yield
- Payout ratio
- Five-year dividend growth rate
- Ten-year dividend growth rate
We calculate each of these factors and summarize them in a final proprietary Q-score. To learn more about how we calculate Q-scores, check out our piece on “7 Factors Used to Select Dividend Growth Stocks.”
The Q-score for Genuine Parts Company is presently 8.0, significantly below our dividend growth portfolio average of 14.6. Most of the Q-score components for GPC are mediocre with the exception of its decent yield. With many better alternatives available, we didn’t include this stock in our own portfolio of 30 dividend growth stocks.
[optin-monster slug=”ziwrnabndtepsyq0fyai”]