AT&T Inc. (NYSE: T) provides telecommunication, media, and technology services worldwide. The company operates three segments: Communications, WarnerMedia, and Latin America. The Communications segment offers wireless communications services, video and targeted advertising, broadband, and wireline telecom services. It also sells hardware and communications-related accessories through company-owned stores, agents, and third-party retail stores. The WarnerMedia segment produces, distributes, and licenses television programming and feature films, mobile and console games, distributes home entertainment products, and offers brand licensing and advertising services. The Latin America segment offers video entertainment and audio programming services, wireless services, and sells communications hardware.
The below table shows AT&T’s revenue breakdown for 2020.
| Segment | 2020 Revenue (in billion USD) | Revenue % |
| Communications | 138.9 | 79% |
| WarnerMedia | 30.4 | 17% |
| Latin America | 5.7 | 3% |
AT&T’s Dividend History and Payout Ratio
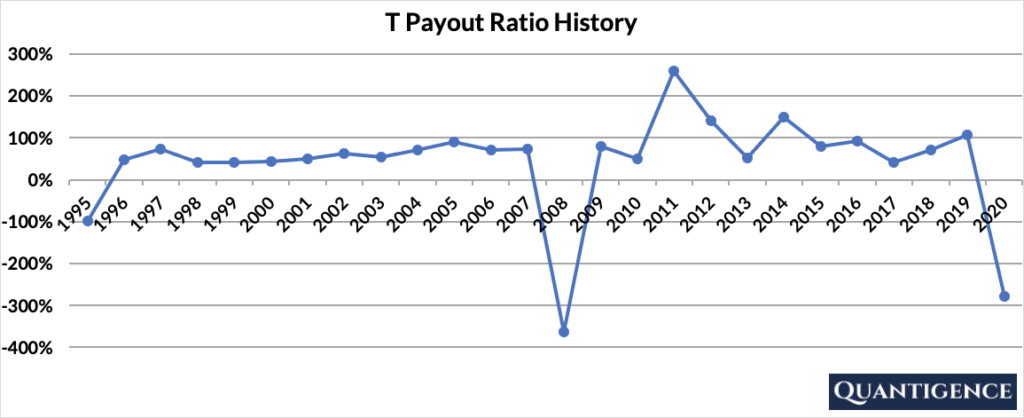
AT&T has been increasing its dividends for 37 years, which places the company just below the average dividend increase track record of 42 years in our investment universe. T’s dividend payout ratio – the percentage of profits paid out as dividends – was negative for 2020 because the company incurred losses over the year thanks to decreasing revenues in all segments coupled with increasing operating expenses. The company’s payout ratio has been volatile since 2008. Six out of the past 13 years, T paid more dividends than the profit it generated.

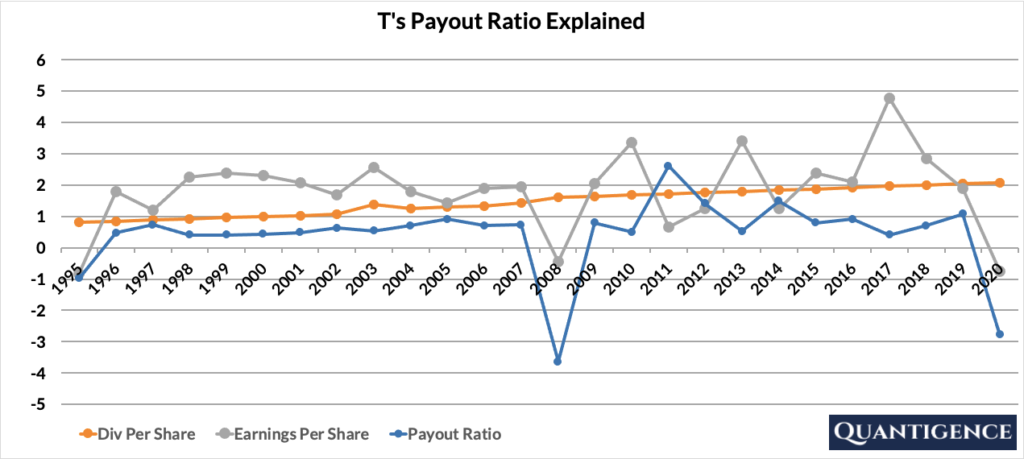
If we look at the two components of payout ratio – dividend per share (DPS) and earnings per share (EPS) – we see a slow incremental DPS increase and highly volatile EPS from 2008 onwards. This is a red flag because T’s business doesn’t seem to support sustainable dividend increases.

AT&T’s Dividend Yield
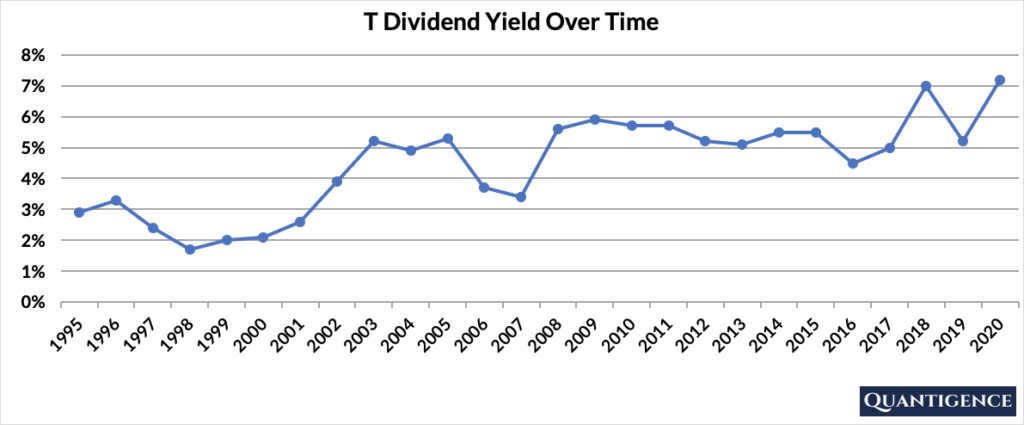
Dividend yield shows the 1-year return on a stock purchase in the form of dividends. It is calculated by dividing the dividend per share paid over the course of a year by the stock price. At the end of 2020, T had a dividend yield of 7.2%, a historic high. Such a high yield seems to be a good thing, but companies with abnormally high yields have the risk of unsustainable dividend increases priced into their share price by investors. Given the volatile earnings history over the past decade, and the unsustainability of dividend increases, we wonder how long T can keep up its status as a dividend champion.

AT&T’s WarnerMedia Spin-Off and Dividend Cut
In the summer of 2020, the elephant in the room was AT&T’s spinoff of WarnerMedia and its announced dividend cut. The company plans to spin off its whole WarnerMedia segment and sell it to Discovery. In parallel, T indicated it will cut its dividends in the region of 50% as a result of the transaction.
The deal is still a year away and concrete information is not yet available. T’s intent to cut its dividend is alarming, but we need to see the exact terms of the spin-off to understand if dividends adjusted to the terms of the transaction will actually decrease.
For example, let’s assume T shares are worth $100 and its dividend is $5. If T sells WarnerMedia for $50 per share and distributes the whole income as a special dividend to shareholders, then the new T shares will be worth $50 theoretically. If the company starts paying anything more than $2.5 in dividends per share after the spin-off, the dividend growth status of the company remains intact because the company value halved and the dividend amount remains more than half. We will keep monitoring the situation and update our readers on the status of T as soon as terms of the upcoming transaction are confirmed.
AT&T’s Dividend Growth Rate
T has been increasing its dividends by a meagre 2.2% on average for the past 10 years and has slowed the increases down to an annual 2.0% over the past five years. Below you can see the effect a 10-year growth rate of 2.2% has on T’s dividend assuming a starting yield of 7.2%.
| Years | Dividend growth | Yield Calculation | Yield % |
| Year 0 | 0% | 7.2% | 7.2% |
| Year 1 | 2.20% | 7.2%*1.022 | 7.36% |
| Year 2 | 2.20% | 7.2%*(1.022)^2 | 7.52% |
| Year 3 | 2.20% | 7.2%*(1.022)^3 | 7.69% |
| Year 4 | 2.20% | 7.2%*(1.022)^4 | 7.85% |
| Year 5 | 2.20% | 7.2%*(1.022)^5 | 8.03% |
| Year 6 | 2.20% | 7.2%*(1.022)^6 | 8.20% |
| Year 7 | 2.20% | 7.2%*(1.022)^7 | 8.38% |
| Year 8 | 2.20% | 7.2%*(1.022)^8 | 8.57% |
| Year 9 | 2.20% | 7.2%*(1.022)^9 | 8.76% |
| Year 10 | 2.20% | 7.2%*(1.022)^10 | 8.95% |
If you bought AT&T at a yield of 7.2%, an average 10-year dividend growth of 2.2% would mean our yield would be 8.95% 10 years from now. This is called “yield on cost,” and shows the yield if the original amount of money invested in the stock remained constant. The main question here is sustainability – can the company continue its dividend increases after a decade of stagnation and will it decide to do so following the WarnerMedia spin-off.
When Does AT&T Pay Dividends?
T pays a quarterly dividend announced by the end of March, June, September, and the middle of December. The ex-dates (the date you need to hold the stock to receive the dividend) are in the first or second week of the following month (April, July, October, January) and dividend payment is made on the first days of May, August, November, and February.
How Strong is AT&T’s Dividend?
When evaluating dividend stocks, we use our own methodology which is based on Q-scores which consist of seven factors:
- Years paying and increasing dividends
- Market cap
- International sales
- Yield
- Payout ratio
- Five-year dividend growth rate
- Ten-year dividend growth rate
We calculate each of these factors and summarize them in a final proprietary Q-score. To learn more about how we calculate Q-scores, check out our piece on “7 Factors Used to Select Dividend Growth Stocks.”
The Q-score for AT&T is presently 8.9 placing the stock in 62nd place in our investment universe. Other than its big size and (unsustainably) high yield, all other indicators penalize AT&T. Dividend growth is slow on both 10-year and five-year time horizons, it has very little international sales, and pays out more dividends than its earnings.
So why is T still in our portfolio? When we built our final 30-stock dividend growth portfolio, we aimed to diversify between the 11 sectors available. T is the only dividend champion in the Telecommunications sector, hence we decided to include it for lack of choice. If the upcoming spin-off results in decreased dividends, we will need to remove AT&T from our portfolio and find another company to replace it.
[optin-monster slug=”ziwrnabndtepsyq0fyai”]


