Nordson Corporation (NASDAQ: NDSN) develops products and systems that dispense, apply, and control adhesives, coatings, polymers, sealants, biomaterials, and other fluids worldwide. It operates two segments: Industrial Precision Solutions (IPS) and Advanced Technology Solutions (ATS). The IPS segment provides dispensing, coating, and laminating systems for adhesives, lotions, liquids, and fibers used in disposable products, packaged goods, thermoplastics, paper and paperboard converting applications, and other diverse consumer and industrial products. The ATS segment provides automated dispensing systems for fluids and related gas plasma treatment systems, plastic molded syringes, cartridges, tips, fluid connection components, tubing, balloons, and catheters.
In short, Nordson is an industrials holding company that focuses on fluid management machinery, serving 12 different industries from aerospace and defense to agriculture and chemicals. The company’s revenues are well-diversified geographically (66% of sales come from international markets), and also between its two divisions, which provides NDSN with consistent revenues over time.
| Segment | 2020 Revenue (in billion USD) | Revenue % |
| Industrial Precision Solutions | 1.14 | 54% |
| Advanced Technology Solutions | 0.978 | 46% |
NDSN’s Dividend History and Payout Ratio
Nordson has an excellent track record of paying and increasing dividends for 57 consecutive years, a record that the company will likely feel highly obligated to maintain. This dividend growth track record makes NDSN a dividend king (a company that has a track record of increasing dividend payouts for more than 50 years), the most prestigious dividend growth category there is.
In 2020, NDSN paid out 32.4% of its profits to shareholders in the form of dividends. The percentage of dividends paid out to shareholders is called the payout ratio, and a low payout ratio such as Nordson’s means there’s can still grow their dividend even if earnings aren’t growing. NDSN’s payout ratio has been consistently low over the past decade.
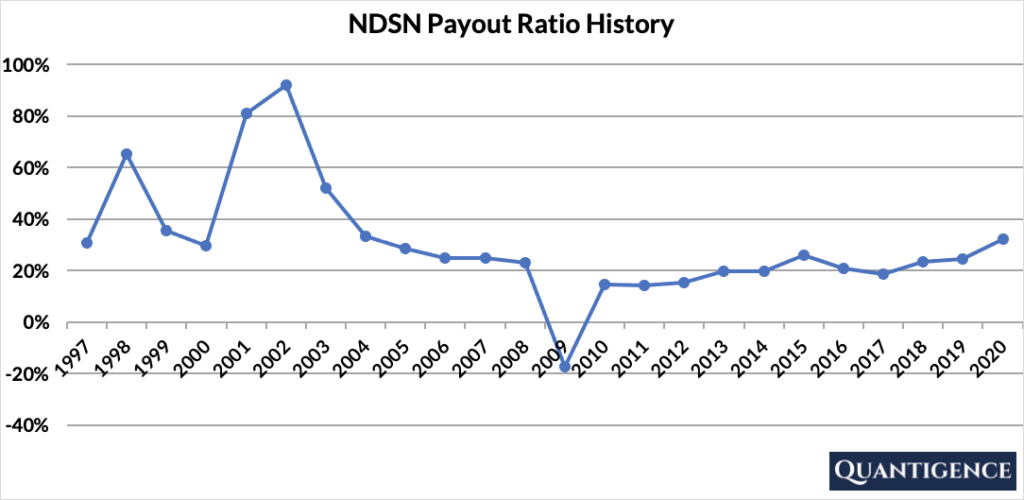
The one year of negative payout in 2009 was caused by one-off goodwill impairments following the 2008 global financial crisis, that resulted in a single year of losses according to the firm’s annual report.
When Does Nordson Pay Dividends?
NDSN pays a quarterly dividend announced in the first half of February, May, August, and December. The ex-dates are in the second half of the same month and payments are made in the first half of the months following the ex-dates (March, June, September, and January). The precise days may differ from each year to the next as these dates are always set to working days.
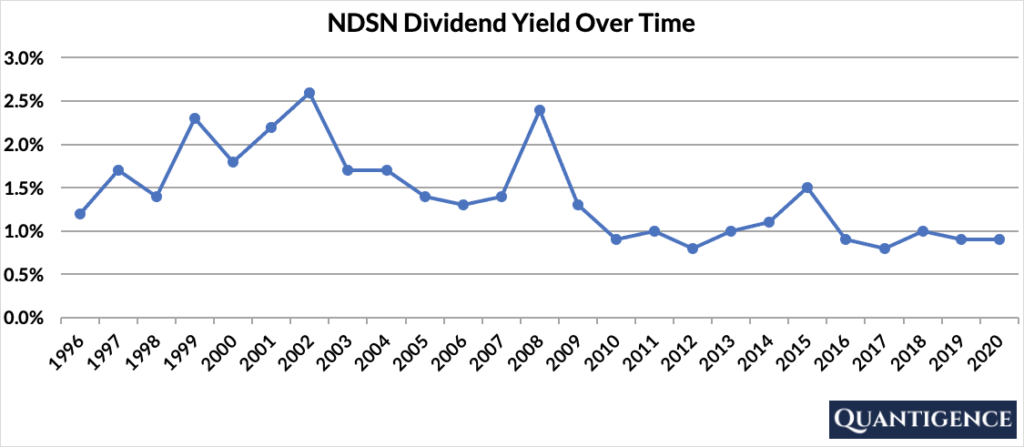
What is Nordson’s Dividend Yield?
The dividend yield – the annual dividend paid divided by the share price – shows the 1-year return on a stock purchase in the form of dividends. In 2020, NDSN had a dividend yield of 0.9%, below the 1.8% average of our investment universe of US dividend champions. This means NDSN’s shares are priced high relative to its dividend payments. The stock’s yield history has been stable over the past 20+ years averaging 1.4%.
Nordson’s Dividend Growth Rate
Nordson has grown its dividend payout by an average of 14.4% every year for the past 10 years. Below you can see the effect a 10-year growth rate of 14.4% has on NDSN’s dividend assuming a starting yield of 0.9% (today’s yield is exactly the same as the yield Nordson had 10 years ago).
| Years | Dividend Growth | Yield Calculation | Yield % |
| Year 0 | 0% | 0.9% | 0.9% |
| Year 1 | 14.40% | 0.9%*1.144 | 1.03% |
| Year 2 | 14.40% | 0.9%*(1.144)^2 | 1.18% |
| Year 3 | 14.40% | 0.9%*(1.144)^3 | 1.35% |
| Year 4 | 14.40% | 0.9%*(1.144)^4 | 1.54% |
| Year 5 | 14.40% | 0.9%*(1.144)^5 | 1.76% |
| Year 6 | 14.40% | 0.9%*(1.144)^6 | 2.02% |
| Year 7 | 14.40% | 0.9%*(1.144)^7 | 2.31% |
| Year 8 | 14.40% | 0.9%*(1.144)^8 | 2.64% |
| Year 9 | 14.40% | 0.9%*(1.144)^9 | 3.02% |
| Year 10 | 14.40% | 0.9%*(1.144)^10 | 3.46% |
If you bought NDSN at a yield of 0.9%, an average 10-year dividend growth of 14.4% would mean our yield would be 3.46% 10 years from now. This is called “yield on cost,” and shows the yield if the original amount of money invested in the stock remained constant.
How Strong is Nordson’s Dividend?
When evaluating dividend stocks, we use our own methodology which is based on Q-scores which consist of seven factors:
- Years paying and increasing dividends
- Market cap
- International sales
- Yield
- Payout ratio
- Five-year dividend growth rate
- Ten-year dividend growth rate
We calculate each of these factors and summarize them in a final proprietary Q-score. To learn more about how we calculate Q-scores, check out our piece on “7 Factors Used to Select Dividend Growth Stocks.”
The Q-score for Nordson Corporation is presently 18.3, the seventh best Q-score in our whole dividend champion investment universe, and the third best among candidates in the Industrials sector. The company’s dividend growth track record, dividend growth rate, payout ratio, and international diversification are all exceptional. It is the fifth smallest company in our investment universe with a market cap of $10 billion. We only penalize it for its very low yield.
In summary, Nordson Corporation is a stable low-yield dividend champion, a great addition to any dividend growth portfolio. Notwithstanding this, at the time we built our portfolio, we passed over NDSN in favor of the next best Industrials stock that had a lower Q-score but a better yield.
[optin-monster slug=”ziwrnabndtepsyq0fyai”]