Dover Corporation (NYSE: DOV) is a diversified global manufacturer and solutions provider holding company classified under the Industrials sector. It is active in five operating segments: Engineered Products, Fueling Solutions, Imaging & Identification, Pumps & Process Solutions, and Refrigeration & Food Equipment.
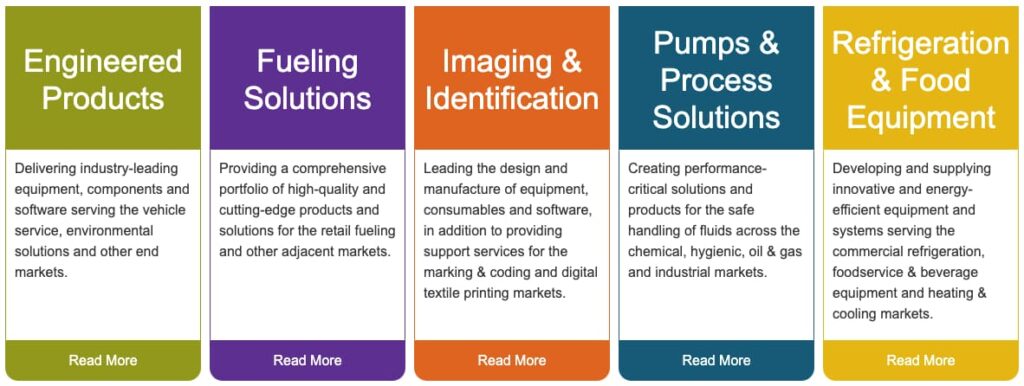
The company’s revenues are well-diversified geographically (46% of sales come from international markets) and between its five divisions which makes DOV more resilient and less risky.
| Segment | 2020 Revenue (in billion USD) | Revenue % |
| Engineered Products | 1.53 | 23% |
| Fueling Solutions | 1.48 | 22% |
| Imaging & Identification | 1.04 | 16% |
| Pumps & Process Solutions | 1.32 | 20% |
| Refrigeration & Food Equipment | 1.32 | 20% |
Even though the company’s revenues decreased by 6.3% over 2020 which is wholly attributed to the COVID-19 pandemic, it still managed to keep its earnings per share level thanks to efficient cost control. This is something we like to see in stable dividend champions like Dover.
Dover’s Dividend History and Payout Ratio
Dover has an excellent track record of paying and increasing dividends for 65 consecutive years, a record that the company will likely feel highly obligated to maintain. This dividend growth track record makes DOV a dividend king (a company that has a track record of increasing dividend payouts for more than 50 years), the most prestigious dividend growth category there is.
In 2020, DOV paid out 41.6% of its profits to shareholders in the form of dividends. A lower payout ratio means that there’s more room for a company to increase their dividend even if earnings aren’t growing. Looking at the history of DOV’s payout ratio over time shows us a slow and steady increase, from around 20% 25 years ago to 42% today – a safe, low ratio with lots of room to grow.
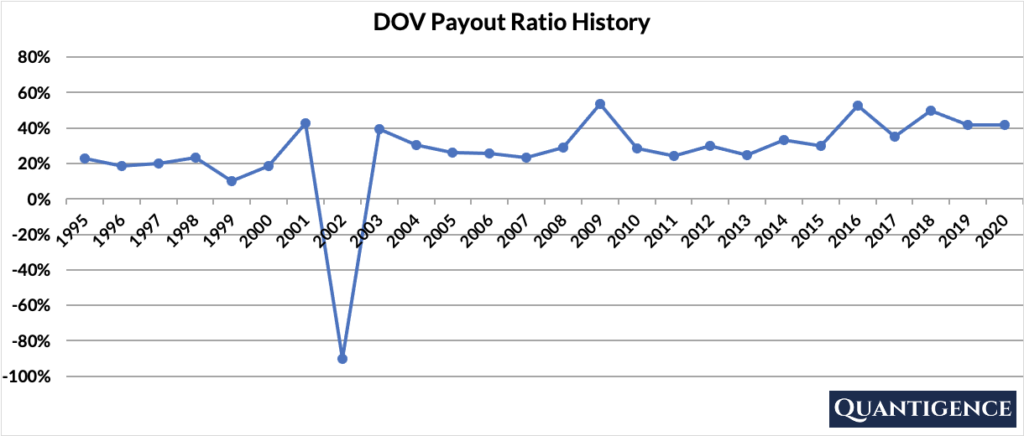
The one year of negative payout in 2002 is attributed to a one-off change in accounting principle by the company that incurred a cumulative negative earnings effect – a one-off technical change without consequences for the business.
When Does Dover Pay Dividends?
DOV pays quarterly dividends that are announced in February, May, August, and November. The ex-dates are in the last weeks of the month of announcement and payments are made in the middle of each of the months following the ex-dates (March, June, September, and December). The precise days may differ from each year to the next as these dates are always set to working days.
What is Dover’s Dividend Yield?
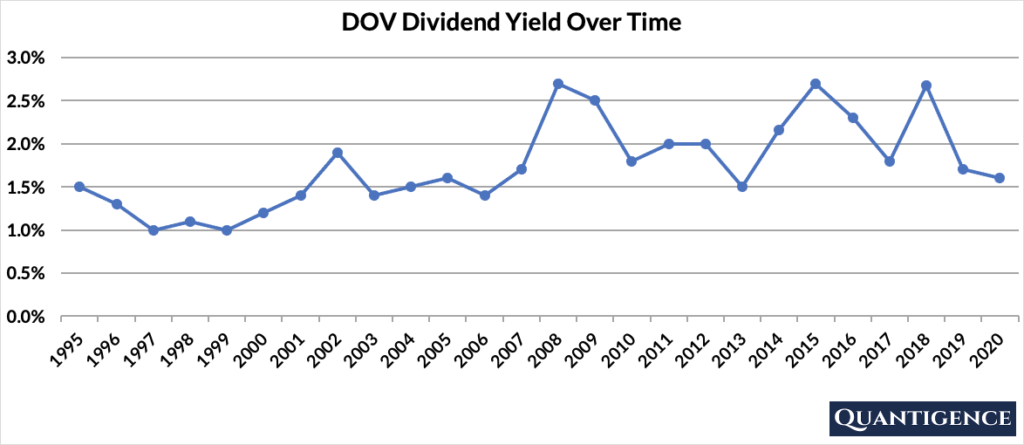
Dover’s dividend yield – the annual dividend paid divided by the share price – shows the 1-year return on a stock purchase in the form of dividends. As of the end of 2020, DOV had a dividend yield of 1.6%, below the 1.8% average of our investment universe of US dividend champions. This means DOV’s shares are priced relatively high compared to its dividend payments. The stock’s yield history has been remarkably stable over the past 25 years with an average of 1.75%.
Dover’s Dividend Growth Rate
Dover has increased its dividend payout by an average of 6.3% every year for the past 10 years. However, dividend increases have slowed to an annual average of only 3.7% in the past five years. Below you can see the effect a 10-year growth rate of 6.3% has on DOV’s dividend assuming a starting yield of 1.6%.
| Years | Dividend Growth | Yield Calculation | Yield % |
| Year 0 | 0% | 1.6% | 1.6% |
| Year 1 | 6.30% | 1.6%*1.063 | 1.70% |
| Year 2 | 6.30% | 1.6%*(1.063)^2 | 1.81% |
| Year 3 | 6.30% | 1.6%*(1.063)^3 | 1.92% |
| Year 4 | 6.30% | 1.6%*(1.063)^4 | 2.04% |
| Year 5 | 6.30% | 1.6%*(1.063)^5 | 2.17% |
| Year 6 | 6.30% | 1.6%*(1.063)^6 | 2.31% |
| Year 7 | 6.30% | 1.6%*(1.063)^7 | 2.45% |
| Year 8 | 6.30% | 1.6%*(1.063)^8 | 2.61% |
| Year 9 | 6.30% | 1.6%*(1.063)^9 | 2.77% |
| Year 10 | 6.30% | 1.6%*(1.063)^10 | 2.95% |
If you bought DOV at a yield of 1.6%, an average 10-year dividend growth of 6.3% would mean our yield would be 2.95% 10 years from now. This is called “yield on cost,” and shows the yield if the original amount of money invested in the stock remained constant.
How Strong is Dover’s Dividend?
When evaluating dividend stocks, we use our own methodology which is based on Q-scores which consist of seven factors:
- Years paying and increasing dividends
- Market cap
- International sales
- Yield
- Payout ratio
- Five-year dividend growth rate
- Ten-year dividend growth rate
We calculate each of these factors and summarize them in a final proprietary Q-score. To learn more about how we calculate Q-scores, check out our piece on “7 Factors Used to Select Dividend Growth Stocks.”
The Q-score for Dover Corporation is presently 13.7, below the portfolio average of 14.6 but higher than our investment universe average of 13.1. This is a decent overall Q-score but not enough to get Dover into our 30-stock final portfolio. We’re not only selecting stocks based on their overall Q-score but also diversify between sectors as much as possible. Dover is classified under Industrials, a very competitive sector with 16 members, of which Dover is 12th.
We penalize the company for its low five-year dividend growth. We reward it for its diversified business and low payout ratio. The rest of the factors remain mediocre and contribute to DOV’s Q-score with low amounts. In summary, Dover Corporation is a stable low-growth dividend champion that’s outshined by its peers.
[optin-monster slug=”ziwrnabndtepsyq0fyai”]