Cintas Corporation (NASDAQ: CTAS) provides corporate identity uniforms and related business services primarily in the United States, Canada, and Latin America. It operates through three segments:
- Uniform Rental and Facility Services rents and services uniforms and other garments, provides restroom cleaning services and supplies, as well as sells uniforms
- First Aid and Safety Services offers first aid and safety products and services
- All Other covers fire protection services and uniform direct sales
| Segment | 2020 Revenue (USD billions) | Revenue % |
| Uniform Rental and Facility Services | 5.64 | 80% |
| First Aid and Safety Services | 0.71 | 10% |
| All Other | 0.73 | 10% |
Cintas doesn’t break out its international revenues in its financial reports, so for the purposes of this analysis, we assume they are insignificant.
CTAS’ Dividend History and Payout Ratio
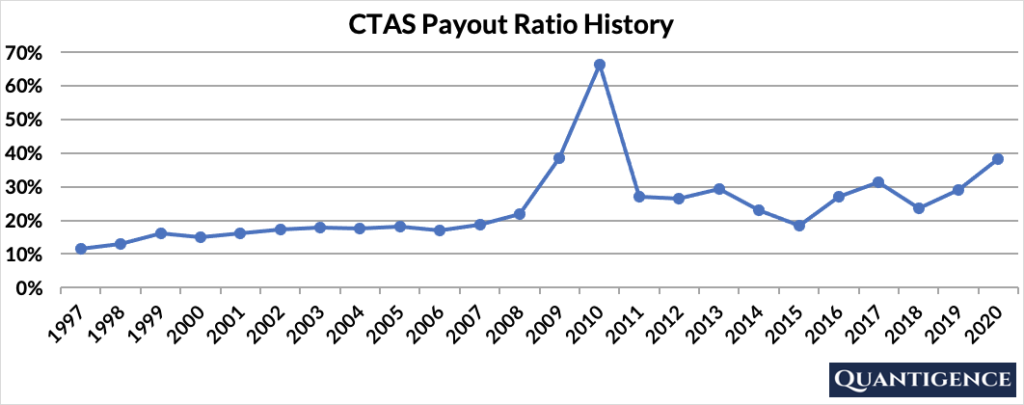
CTAS has a track record of paying and increasing dividends for 39 consecutive years, a record that the company will feel highly obligated to maintain. In 2020, the company paid out only 38% of its profits in the form of dividends. This low payout ratio enables the company to keep growing its dividend in the future, even if earnings are not growing or temporarily declining.
In looking at the company’s payout ratio history over the past 24 years, it’s been relatively stable with an average of 24%. CTAS’ payout ratio spiked in 2010 because it switched from having its dividend ex-date in February to have it in November. This way 2010 became a single calendar year of two regular dividend payments.
When Does CTAS Pay Dividends?
CTAS has recently changed its dividend policy from annual dividends to quarterly. The company’s last annual dividend was declared in October 2020, has gone ex on 5 November 2020, and got paid on 4 December 2020. Going forward, the company’s dividends will become quarterly with ex-dates in February, May, August, and November and payment days on the 15th of the following months.
What is CTAS’ Dividend Yield?
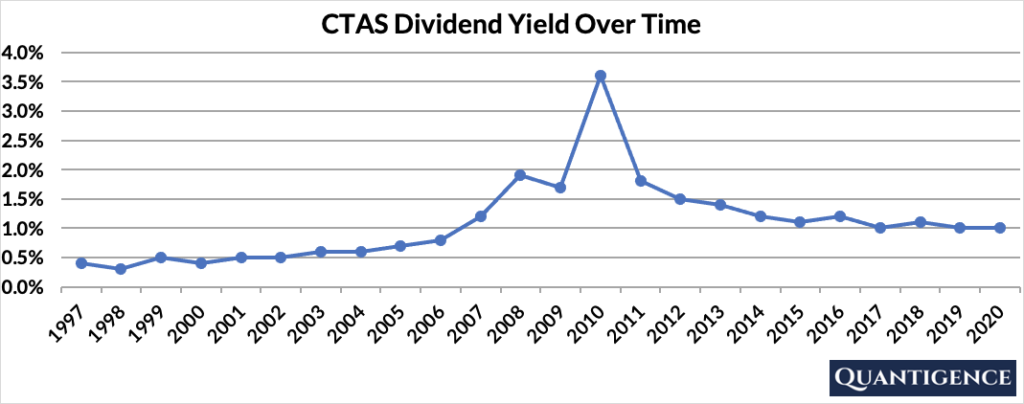
Dividend yield (the annual dividend paid divided by the share price) shows the 1-year income for a stock from dividends. In 2020, CTAS had a dividend yield of 1.0%, almost half of our investment universe average of 1.8%. The stock’s historical yield has been moving between 0.3% and 1.9% with an average of 1.1%.
2010’s yield spiked because of the aforementioned dividend schedule change where CTAS paid out two annual dividends with ex-dates in February and November. We don’t count this year’s yield in the long-term average as it’s a one-time anomaly.
CTAS’ Dividend Growth Rate
CTAS has grown its dividend by an average of 21.9% every year for the past 10 years. That high growth rate seems to be increasing with the annual average being 27.3% over the last five years. Below you can see the effect a 10-year growth rate of 21.9% has on CTAS’ dividend assuming a starting yield of 1.0%.
| Years | Dividend Growth | Yield Calculation | Yield % |
| Year 0 | 0% | 1.00% | 1.0% |
| Year 1 | 21.90% | 1.0%*1.219 | 1.22% |
| Year 2 | 21.90% | 1.0%*(1.219)^2 | 1.49% |
| Year 3 | 21.90% | 1.0%*(1.219)^3 | 1.81% |
| Year 4 | 21.90% | 1.0%*(1.219)^4 | 2.21% |
| Year 5 | 21.90% | 1.0%*(1.219)^3 | 2.69% |
| Year 6 | 21.90% | 1.0%*(1.219)^6 | 3.28% |
| Year 7 | 21.90% | 1.0%*(1.219)^7 | 4.00% |
| Year 8 | 21.90% | 1.0%*(1.219)^8 | 4.88% |
| Year 9 | 21.90% | 1.0%*(1.219)^9 | 5.94% |
| Year 10 | 21.90% | 1.0%*(1.219)^10 | 7.24% |
If you bought CTAS at a yield of 1.0%, an average 10-year dividend growth of 21.9% would mean your yield would be 7.24% 10 years from now. This is called “yield on cost,” and shows the yield you’re receiving on the original amount of money you invested.
How Strong is CTAS’ Dividend?
When evaluating dividend stocks, we use our own methodology which is based on Q-scores which consist of seven factors:
- Years paying and increasing dividends
- Market cap
- International sales
- Yield
- Payout ratio
- Five-year dividend growth rate
- Ten-year dividend growth rate
We calculate each of these factors and summarize them in a final proprietary Q-score. To learn more about how we calculate Q-scores, check out our piece on “7 Factors Used to Select Dividend Growth Stocks.”
The Q-score for Cintas Corporation is presently 15.1, the seventh-best Q-score in the industrials sector consisting of 16 dividend champions. We reward CTAS for its dividend growth track record, low payout ratio, and both its five and 10-year dividend growth rates which together are the highest growth rates in our investment universe. We penalize the company for its low yield and lack of international sales. CTAS’ size contributes little to its overall Q-score.
Cintas has outstanding dividend growth rates but its final Q-score is depressed by its yield and international sales. With a number of better alternatives, we do not include CTAS in our final 30-stock dividend growth portfolio.
[optin-monster slug=”ziwrnabndtepsyq0fyai”]