If we were pressed to provide one single stock that an investor should buy if they could only hold one stock, it would be Johnson and Johnson (NYSE: JNJ). That’s based on a top-down approach that assumes healthcare isn’t going anywhere. Regardless of what happens to the global economy, people will always need healthcare services. While people might associate JNJ with baby shampoo and Tylenol, the company actually consists of three segments – Consumer Health (17%), Pharmaceutical (55%), and Medical Devices (28%).

These three segments provide an element of diversification that provides JNJ with a certain amount of stability over time. Knowing the ins and outs of what Johnson & Johnson does is not nearly as important as knowing about their track record of paying dividends which is simply remarkable. Not only has JNJ paid a dividend for 58 years in a row, but they’ve increased it for 58 years in a row. That’s longer than Jeff Bezos has been alive.
Does Johnson and Johnson Pay Dividends?
Companies that operate a profitable business need to decide what to do with their profits. If the business is an early-stage growth company, they’ll plow back earnings into the company and reinvest them in their business. Alternatively, they’ll give some of that cash back to shareholders. The percentage of profits that are returned to shareholders is called the payout ratio. If a company’s payout ratio is 50%, that means they pay our half their profits in dividends to shareholders. Right now, Johnson & Johnson pays out 71% of their profits to shareholders in the form of dividends. There’s every reason to believe they’ll continue to pay that dividend growing forward based on their track record.
A lower payout ratio means that there’s more room for a company to increase their dividend even if earnings aren’t growing. A look at the history of JNJ’s payout ratio over time shows us a steady increase, from 38% 20 years ago to 71% today.
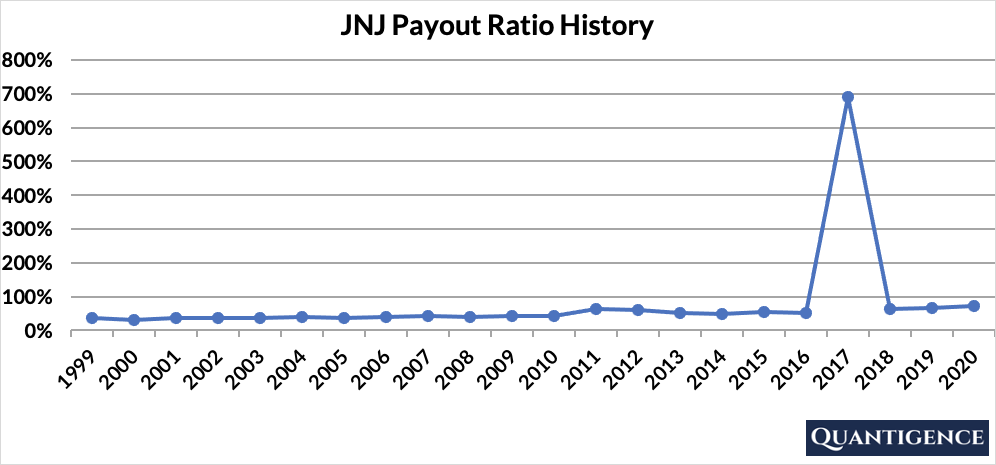
We see a big spike in the payout ratio at the end of 2017 that looks suspicious. After a bit of digging into JNJ’s annual report for the year, we found that in December 2017, new U.S. tax legislation was enacted that included a comprehensive overhaul of the corporate income tax code. Besides decreasing the corporate income tax, it also eliminated certain corporate tax deductions and introduced new provisions that taxed foreign income not previously taxed by the United States.
These new rules forced Johnson and Johnson to create provisions for these new tax items from its annual earnings, virtually eliminating most of JNJ’s earnings for 2017. As JNJ’s earnings decreased so did its earnings per share. When JNJ continued to pay an increasing dividend from a fraction of its earnings, the payout ratio jumped significantly.
If we correct this earnings drop attributable to one-off regulatory changes, we see a much smoother payout ratio history:
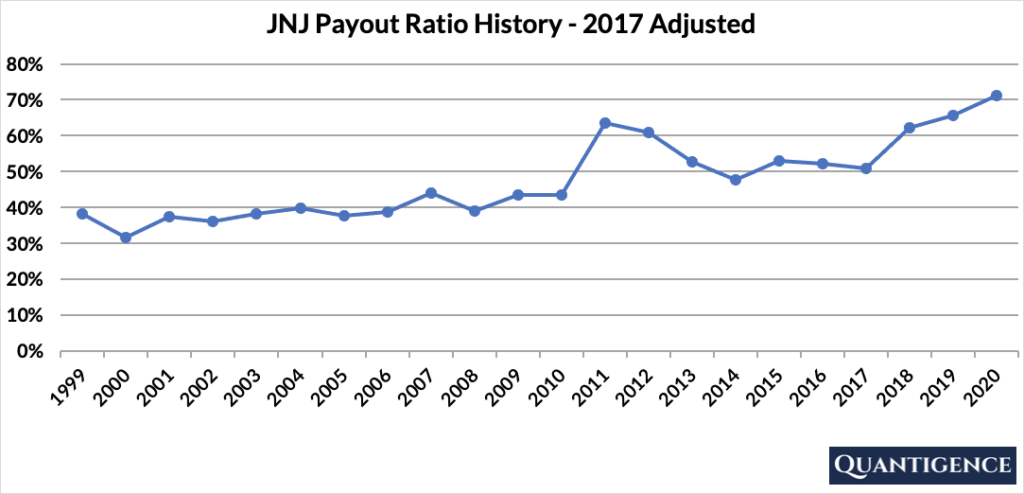
As investors, the JNJ tax event tells us that the company is resilient in its commitment to paying a continuously increasing dividend, even in the face of unforeseen challenges. This is the kind of approach we’re looking for in a stock that’s a dividend champion.
Johnson and Johnson’s Dividend History
Johnson & Johnson has been paying a dividend for 58 years in a row, but that’s not nearly as impressive as having grown the dividend for 58 years in a row. That means every year you would receive a larger dividend. How much larger? Well, over the past 10 years JNJ increased their dividend by an average of 6.55% per year. Imagine your paycheck increase by 6.55% every year. You’d hold on to that job for dear life, wouldn’t you? This is exactly what happens with JNJ’s stock. Investors get a payout increase way above inflation.
Johnson and Johnson’s Dividend Growth Rate
JNJ has increased its dividend payout by an average of 6.55% every year for the past 10 years. However, that number seems to be decreasing lately with the annual dividend increase averaging 6.2% over the last five years. Below you can see the effect a 10-year growth rate of 6.55% has on JNJ’s dividend assuming a starting yield of 2.5%.
| Years | Dividend growth | Yield Calculation | Yield % |
| Year 0 | 0% | 2.5% | 2.5% |
| Year 1 | 6.55% | 2.5%*1.0655 | 2.66% |
| Year 2 | 6.55% | 2.5%*(1.0655)^2 | 2.84% |
| Year 3 | 6.55% | 2.5%*(1.0655)^3 | 3.02% |
| Year 4 | 6.55% | 2.5%*(1.0655)^4 | 3.22% |
| Year 5 | 6.55% | 2.5%*(1.0655)^5 | 3.43% |
| Year 6 | 6.55% | 2.5%*(1.0655)^6 | 3.66% |
| Year 7 | 6.55% | 2.5%*(1.0655)^7 | 3.90% |
| Year 8 | 6.55% | 2.5%*(1.0655)^8 | 4.15% |
| Year 9 | 6.55% | 2.5%*(1.0655)^9 | 4.43% |
| Year 10 | 6.55% | 2.5%*(1.0655)^10 | 4.71% |
If you bought JNJ at its current yield of 2.5%, an average 10-year dividend growth of 6.55% would mean our yield would be 4.71% 10 years from now. This is called “yield on cost,” and shows the yield if the original amount of money invested in the stock remained constant.
What is Johnson and Johnson’s Yield?
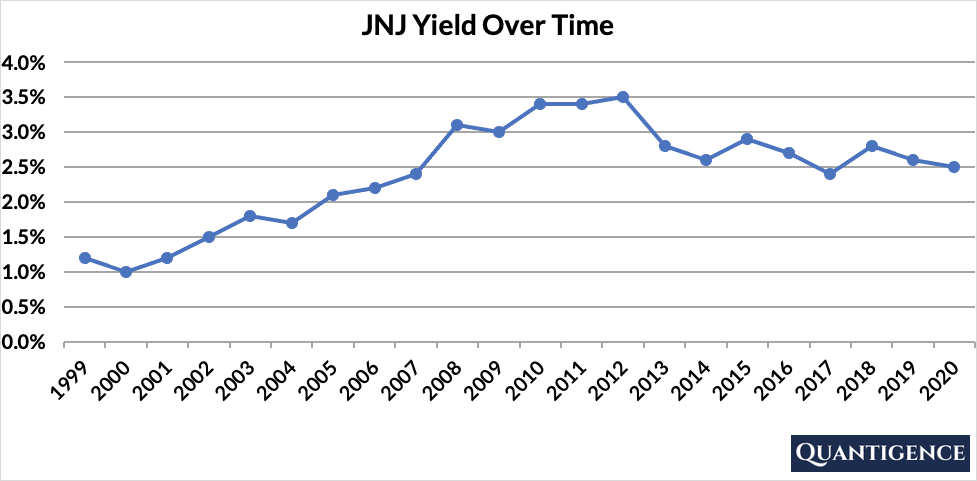
JNJ’s current yield is 2.5%, exactly the same as the stock’s 20-year average. As the below chart shows, the company’s yield has never exceeded 3.5% over the past 20 years. If you’re waiting for the yield to improve before you buy the stock, you’ll probably be waiting a long time.
When Does Johnson and Johnson Pay Dividends?
JNJ pays quarterly dividends that are announced in January, April, July, and October. The ex-dates are usually in the last weeks of February, May, August, and November. (The ex date is the date on which a shareholder needs to hold a stock to receive the dividend payment.) Payments are made in the second week of each of the months following the ex-dates (March, June, September, and December). The precise days may differ from each year to the next as these dates are always set to working days.
How Strong is the JNJ Dividend?
When evaluating dividend stocks, we use our own methodology which is based on Q-scores which consist of seven factors:
- Years paying and increasing dividends
- Market cap
- International sales
- Yield
- Payout ratio
- Five-year dividend growth rate
- Ten-year dividend growth rate
We calculate each of these factors and summarize them in a final proprietary Q-score. To learn more about how we calculate Q-scores, check out our piece on “7 Factors Used to Select Dividend Growth Stocks.”
The Q-score for Johnson and Johnson is presently 19.5, a number that places it in the second place in all our dividend growth stock universe. It is a dividend champion with a great dividend growth track record, large market cap size, stable dividend growth, and a geographically diversified business. While JNJ’s payout ratio keeps increasing steadily, it still has a lot of leeway to keep increasing its dividends from its profit. This is why we believe JNJ to be one of the best dividend growth stocks out there.
[optin-monster slug=”ziwrnabndtepsyq0fyai”]